June 2024 was a mandate for course correction. While it would be simplistic to argue that economic conditions alone decide people’s political choices, it may not be an exaggeration to say employment (along with inflation) was by far the most decisive issue in determining what happened on June 4 this year.
Budget 2024, being the first budget of the new government, was, therefore, not a routine budgeting exercise. It was a political opportunity to show the government was reading the mandate correctly. Through the Union Budget 2024 and the Economic Survey 2024, the government has at least acknowledged there is a serious employment crisis in the economy. However, acknowledging the disease is not the same as finding the cause or providing a treatment. Has the Budget 2024 done that? We try to answer this question against the backdrop of a broader macroeconomic milieu.
A Long Durée Take on India’s Macroeconomy
To get a bird’s eye view of the current economic condition, we take a long-term look starting with the Indian economic reforms of 1991. Chart 1 shows that not only has there been an economic slowdown under the current dispensation (often called Modi 1.0 (2014-19) and 2.0 (2019-24)) as compared to the United Progressive Alliance (UPA) regime, the average growth rate is even lower than what was witnessed between 1991-2003. This slowdown holds true for all the components of the gross domestic product (GDP). This shows that there is no source of demand, which has so far led to the recovery of the economy. This is a serious problem.

To be sure, not all of it is the current dispensation’s doing. Some they inherited (the Non-Performing Assets or NPA problem), and some were natural (the Covid crisis). But they added two of their own — the ill-thought demonetisation of 2016 and the hasty, mismanaged implementation of the Goods and Services Tax of 2017. These economy-wide macroeconomic shocks within a span of 8 months dealt a body blow to an already slowing economy. As a result of which the economy went into a slowdown with a continuous fall in the quarterly growth rate since March 2018, 8-quarters ahead of the Covid-induced contraction in 2020.
The problem is not limited to the slowdown; even this lower growth was very skewed in favour of the upper strata of the population, what has often been called the K-shaped growth. To be sure, inequality, both income and wealth, has been rising since the reforms. But a rising inequality, which uplifts all is still a better outcome than one where the poorer sections’ income stagnates or, worse, falls.
For growth to spread across classes, it needs to generate economic forces that push wage rates up across the board; pull excess labour out of agriculture (the disguised unemployed) towards (in)formal non-farm jobs; pull those in informal jobs out towards better paying formal jobs; and so on.
Studies on employment have shown that between 2004-05 and 2011-12, such a process, at least partially, was on. The spectrum of real wage rates was rising, particularly under UPA-II (chart 2a); agricultural labourers were moving out of agriculture (chart 2b) towards non-farm jobs with relatively better wages (imagine workers moving from the lower curve to the upper one in chart 2a). Both these processes —higher wages for all and workers moving out of lower paid work — led to overall improvement at the lower end of the population.


Since then, wages, both farm and non-farm, have stagnated (chart 2a). Much of the outmigration from agriculture has been reversed since the Covid lockdown (chart 2b), which means workers moved from the upper curve in chart 2a to the lower one, the exact opposite of what happened during the previous regime.
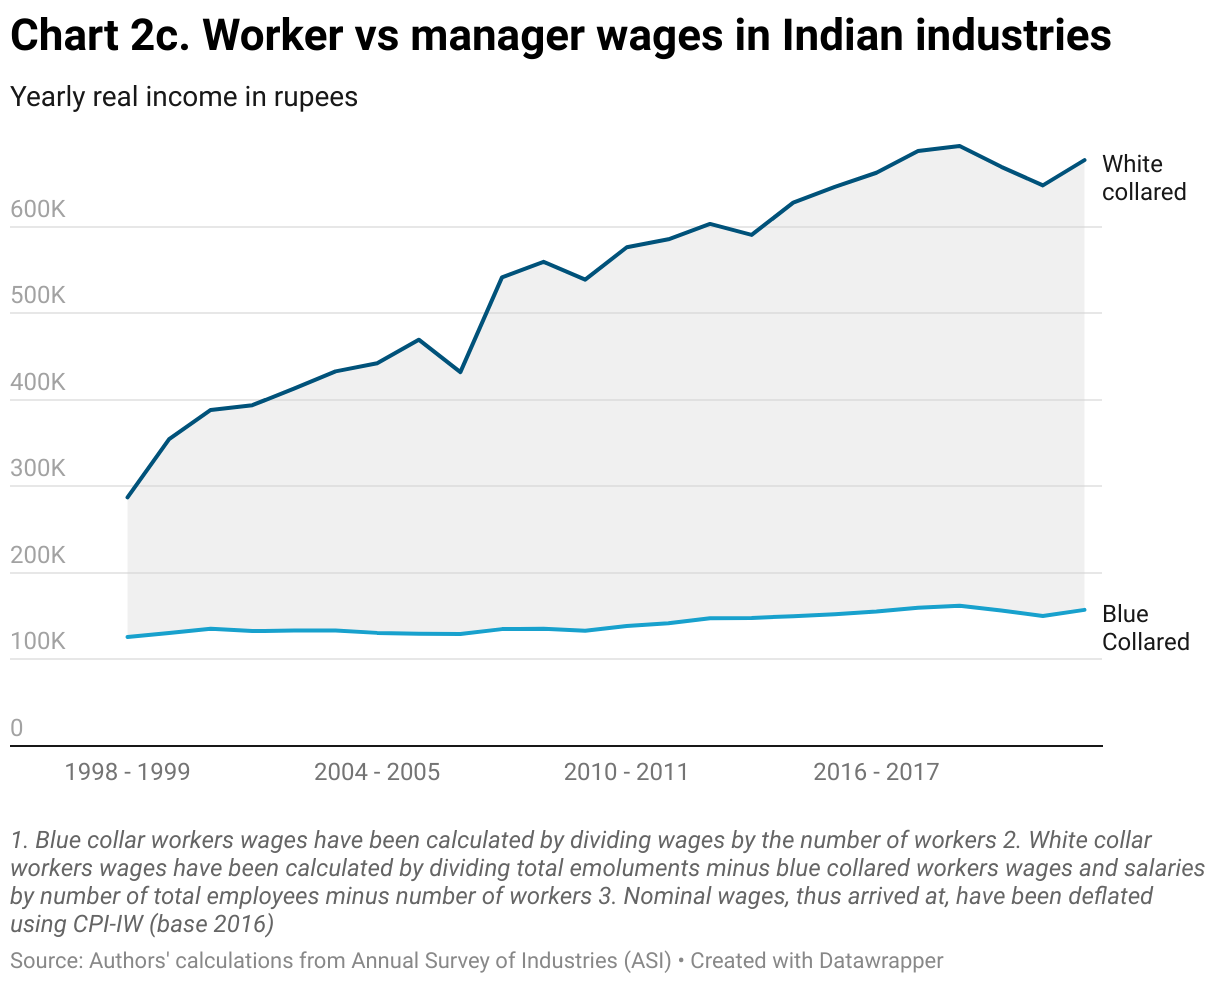
As far as inequality is concerned, it has been rising under both regimes because (a) the formal sector was not absorbing excess labour from elsewhere, (b) within the formal sector, the share of capitalists was rising spectacularly, (c) wages of high-end white collared workers have been rising faster than the rest of the workers (chart 2c).
To understand the reasons behind the 2014-24 slowdown, with stagnation at the lower end of the spectrum, we make a digression into simple national income accounting. GDP constitutes of six sources of demand — workers’ consumption, capitalists’ consumption, government consumption expenditure, public investment, private investment, and exports (net of imports). These goods and services generate income in the form of total wage bill for workers, profits for the capitalists, and taxes for the government. This equality can be represented as,

Dampened workers’ consumption:
A macroeconomic shock such as demonetisation adversely affected the cash-based economic activities at the lower end of the spectrum (essentially affecting workers’ consumption in the relationship mentioned above). The crisis of jobs started as a result. Coming on the back of this shock was the haphazard implementation of the GST, which threw the small enterprises off, which further impacted this source of demand. Then came the draconian lockdowns, which pushed workers to an even lower wage rates, as shown in chart 2a-b, further affecting workers’ consumption.
Elusive private corporate investment:
Corporate investment, which was one of the main drivers of growth during 2004-14, was not in the driving seat any more, initially because of the NPA crisis but later as a result of the slowdown itself. Capitalists invest, partly with borrowed funds, in setting up factories when there is demand for their products. In this instance, both the demand for products and credit availability had choked. The current regime’s exclusive focus on the credit side — through credit easing, lower interest rates (when inflation was low), and insurance for loans — misses this simple point John Maynard Keynes once made,
“For whilst the weakening of credit [read NPA crisis in India] is sufficient to bring about a collapse, its strengthening, though a necessary condition of recovery, is not a sufficient condition.”
Not just credit easing, the government tried other supply side measures like cutting the corporate tax rates by a fourth (from 30% to 22%) in 2019, an act which reduced the tax burden of the corporate sector a great deal (left figure in chart 3) and increased their profit margins significantly (right figure in chart 3). Under usual circumstances, such a reversal in profits would have led to higher investment, which is what the government was banking on.

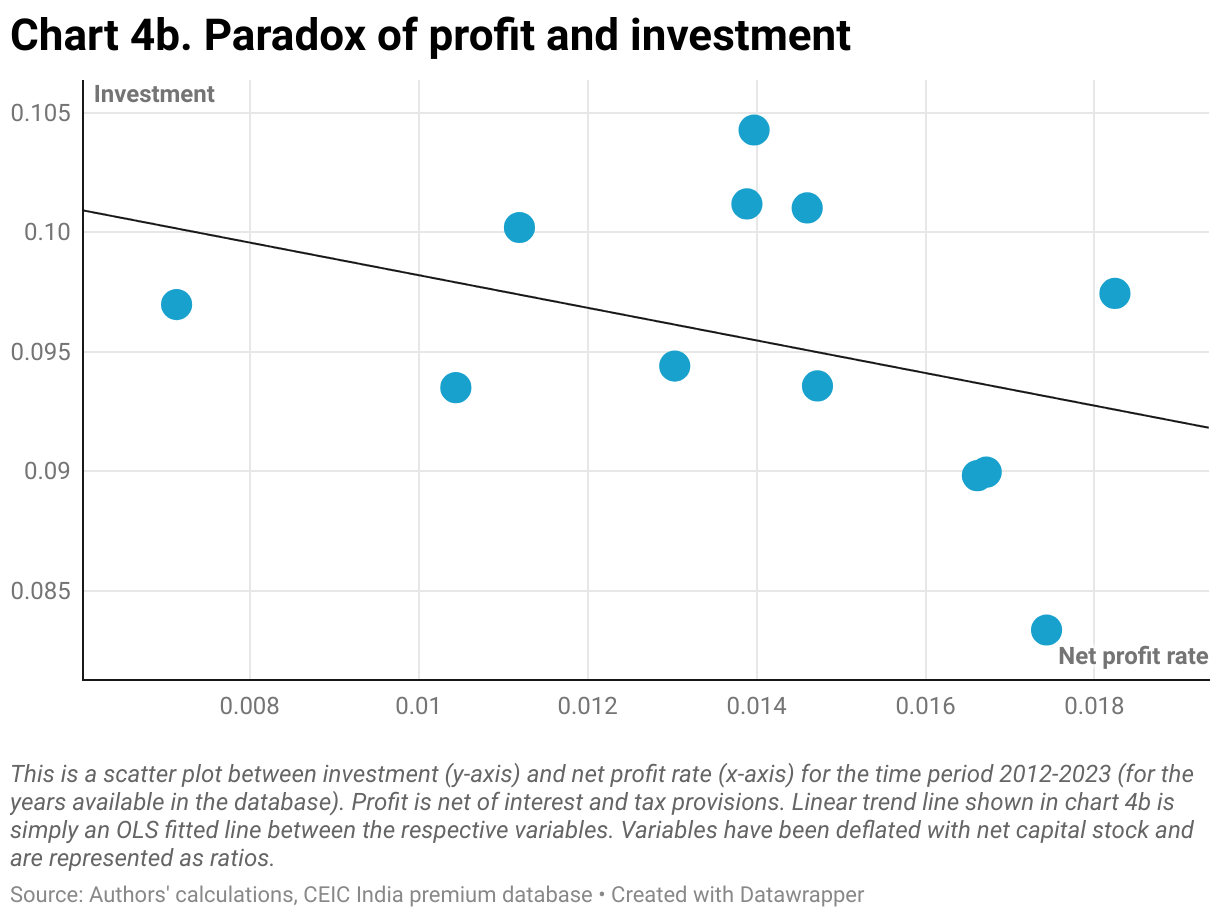
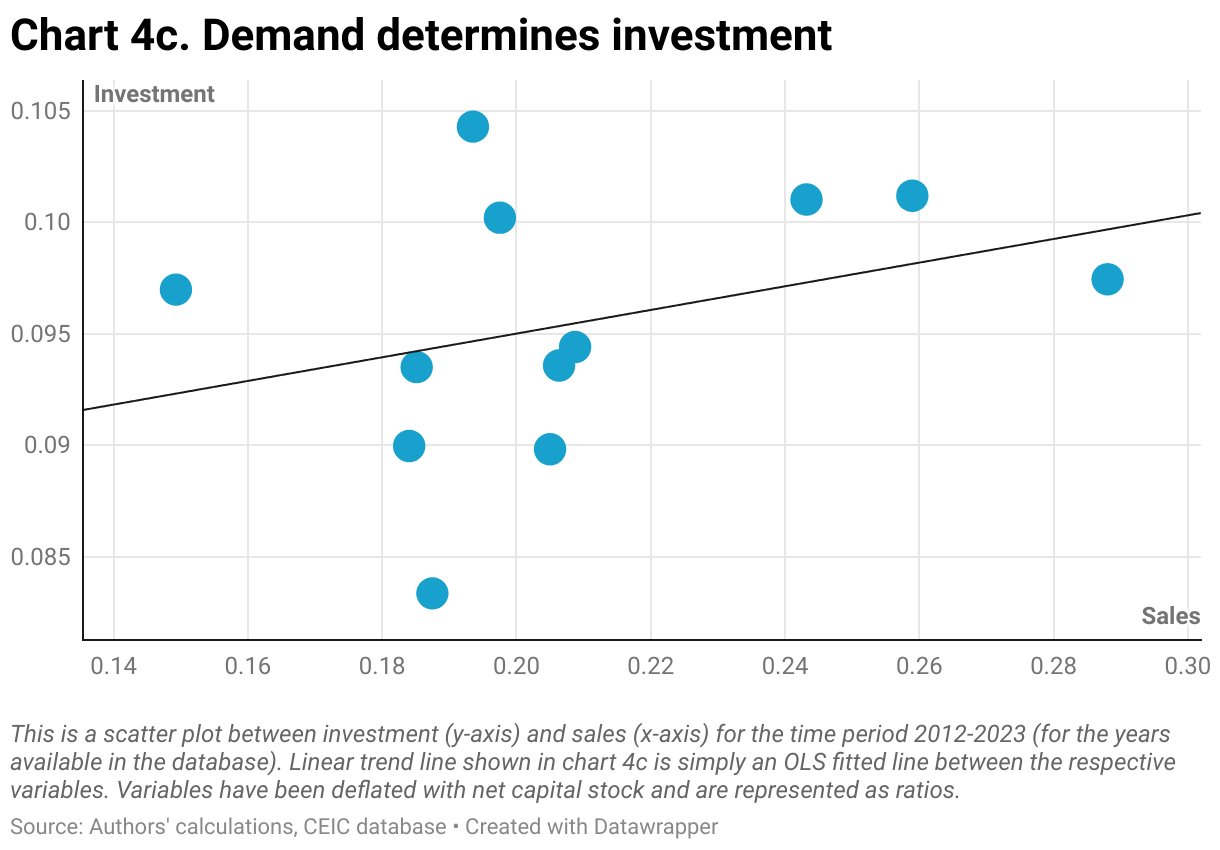
But did the corporates respond with higher investments with this surge in profits? Unfortunately, they didn’t (see chart 4)! In fact, no clear relationship (a flat trend line instead of a negatively sloped one) can be found between the tax cuts and corporate investment (chart 4a) 1These are all simple linear trend line fitted curves and, in that sense a bit simplistic but would suffice here for the purposes of the argument being made. . Chart 4b shows, quite unexpectedly, that corporate investment fell with profitability during this period. Not much should be read into this, however, because, in this instance, high net profitability is not on account of better sales but simply of a lower tax burden. At any rate, the decision to expand capacity will, almost invariably, be related to the current/past use of existing capacity through sales (chart 4c). In other words, investment would rise if there are pressures of excess demand for the products in the market. Chart 4, in very simple terms, explains the myth of supply-side strategies to revive investment. If sales are not picking up, no amount of tax cuts or lower interest rates (both of which result in high net profits) is going to push the corporates to set up factories. A simple and obvious lesson should be learnt from this i.e. a demand-side problem cannot be solved through supply-side measures. Investment responds to demand (and availability of finance) and not merely availability of finance, whether internal (higher retained earnings) or external (credit).

Public investment doing the heavy-lifting:
The lacklustre response of the corporate sector made the government in recent years chip in to shore up public investment in its efforts to propel the economy post-Covid. This effort shows up in a dramatic 13.5% jump in 2022-23 (chart 5) 2The dramatic jump in investment in 2021-22 for the private corporate and household sectors is on account of the base effect of absolute contraction the previous year. The decomposition of total investment in these three categories is not available as yet, hence the comparison ends with 2022-23. , which has kept the economy afloat.

But has this public investment strategy delivered? A closer look at the more recent data reveals where the problem lies in what may be a fragile recovery for India (chart 6). While the economy has seen consistent improvement in all the quarters over the last one year as a result of the government doing most of the heavy lifting (see the jump in fixed investment), the biggest concern is private consumption, the largest component of the GDP, which has grown at half the pace of the GDP. This seems counterintuitive though. If the GDP is rising, incomes must be rising, and consumption should have kept pace at the very least (in terms of the rate of growth). But why has it not?

We believe a large-scale government Capex-driven recovery would generate fewer jobs relative to other forms of more labour-intensive expenditure, hence a large part of this Capex (public investment on the right side of the relationship discussed above) has translated mostly into rising profits (on the left side), not so much into higher wage income. In other words, only a small section of the population, the capitalists and the white collared workers, have reaped most of the benefits of this capital push. Readers can imagine how many workers are employed in building multi-lane national highways or airports since most of these projects are quite capital intensive. Such government expenses would get translated, therefore, more into profits for the outsourced agencies who are undertaking the construction or the corporations which are supplying the machines for it. That is not to say workers would not be employed at all but it’s beyond doubt that capital per unit of labour in such big ticket public investment projects would be high and, hence, employment quite low. The problems of stagnant wage income and worsening employment situation, which started with demonetisation, have not then been solved despite this Capex push. No wonder a few months before the elections, an overwhelming majority of respondents during the CSDS survey felt that job prospects had worsened or that they did not have enough income to save.
The problem of jobs, especially in the informal sector, is serious and has been so for quite some time. And a situation such as this required an objective analysis and a roadmap to get out of it. The Economic Survey 2024 and Budget 2024 were up against this challenge, but have they read the writing on the wall?
Has Budget 2024 measured up to this challenge?
It’s true that both the Economic Survey and the Budget have accepted job creation as a problem afflicting the economy. They have also acknowledged that, despite the increased public investment, the corporate sector has not risen to the challenge. Sadly, the roadmap they propose is a run-of-the-mill supply side response. Let us take the much talked about employment linked incentives (ELI) that the 2024 Budget has introduced.
The three schemes proposed under this initiative provide incentives to the corporate sector to generate jobs, much like making cheap credit available or higher retained earnings through tax cuts. There is enough evidence to show that the job situation in India is, to a significant extent, a problem of a lack of demand for jobs, so a supply side solution alone will not work. Chart 7 shows the nature of un/employment and their earnings prevailing in the country today. According to the PLFS 2022-23 round, as presented quite succinctly here, those who earned the least saw the deepest fall in their wages. Only the regular workers, i.e. one in five workers, saw an increase in their earnings. Both the self-employed, the largest contingent of workers in India, and the casual workers have lost in absolute terms during 2022-23.

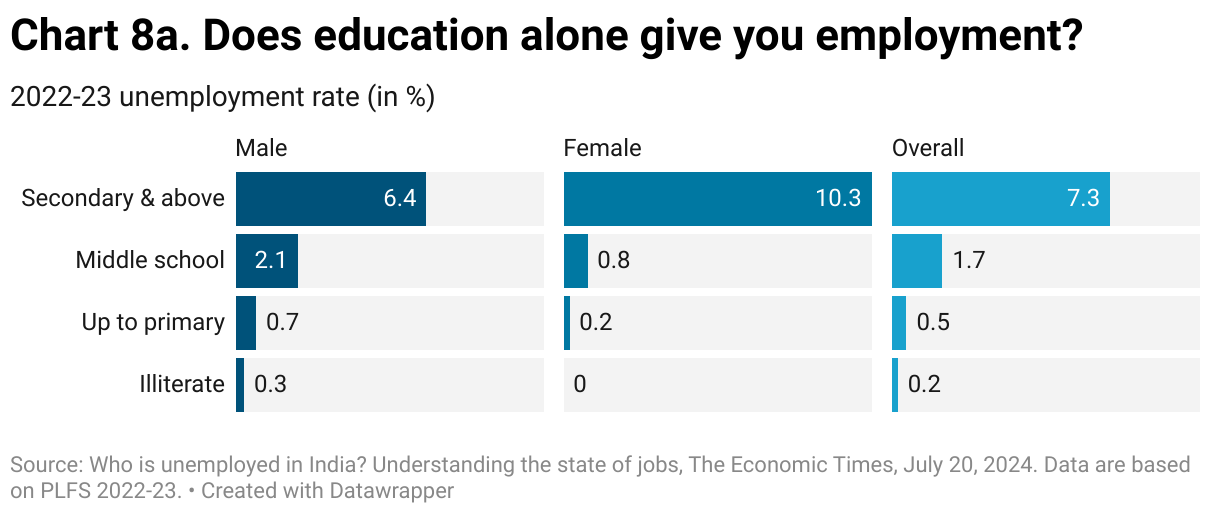
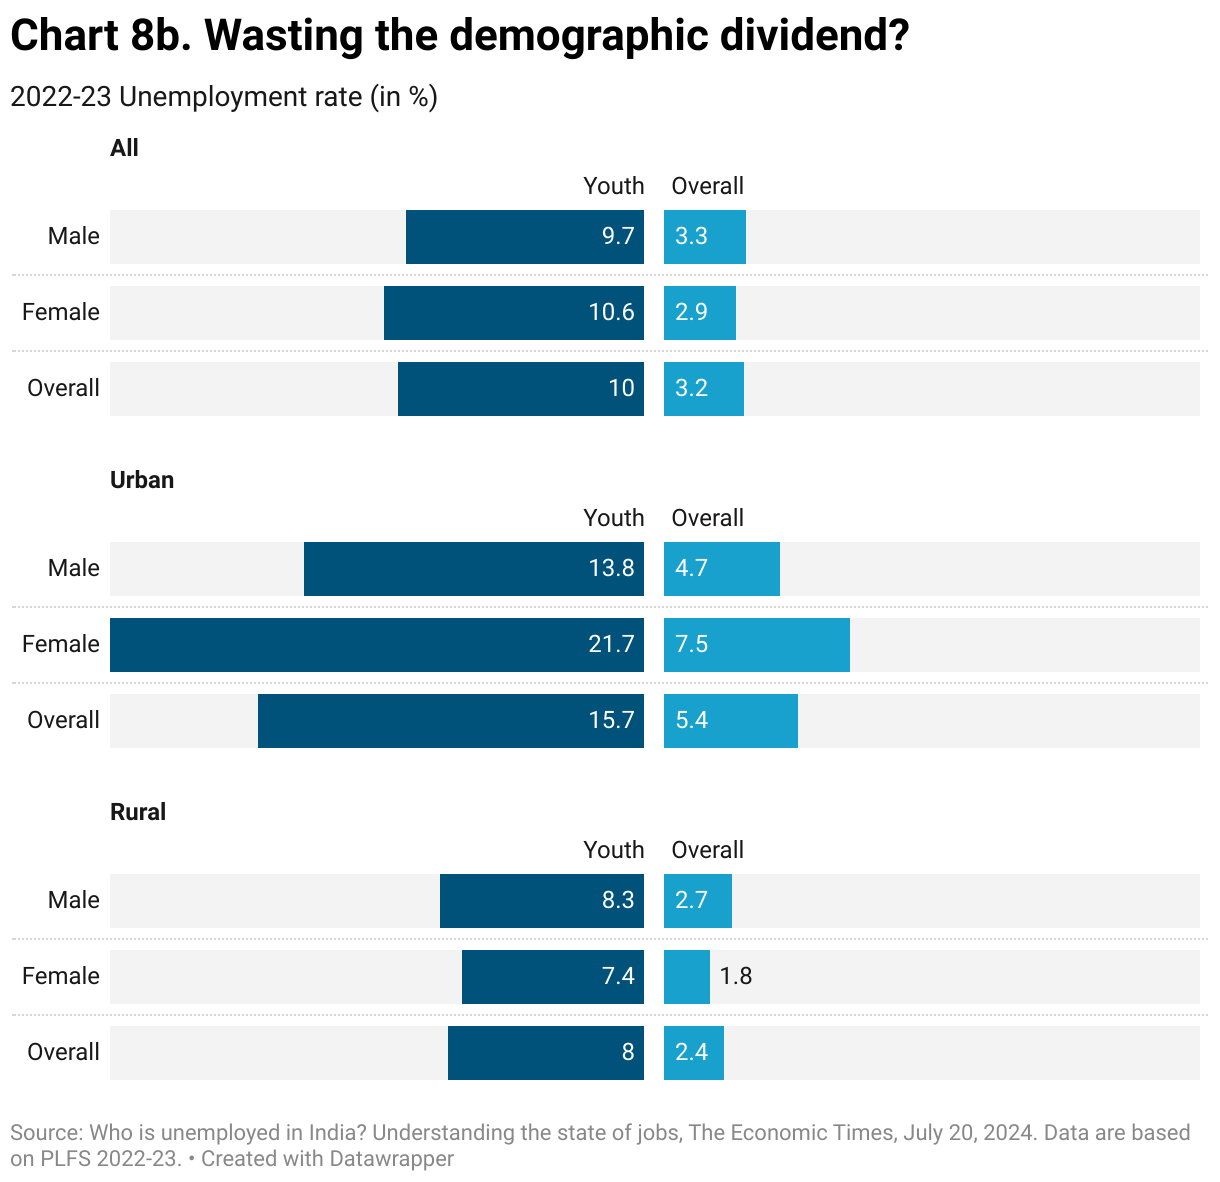
What about those who are unemployed? Are they unemployed because they lack skills or education? Data from the same round of PLFS shows that unemployment increases as you move up the education ladder (chart 8a). The most educated have the highest unemployment rate. So, skills or knowledge alone cannot fetch you a job in today’s labour market. Another serious problem on the unemployment front, which is well documented, is that a large part of the burden has fallen on the youth (age 15-29) of this country (chart 8b). The highest unemployment rate is among women in the urban areas — a whopping 22%. So, it is clear that the unemployment (or low earnings) problem is not from the side of the workers but that of the job creators. There are just not enough decent jobs.
But can the job creators be enticed into creating more jobs? Alas, as argued here, it is not so simple. For example, even if the corporates were to oblige by offering paid internships under the ELI scheme for one year as proposed, there is no guarantee that these workers would be absorbed the next year. Corporates would create jobs if there is (or they expect) enough demand for the goods they produce, not because they are getting tax breaks for generating these jobs. Why would they employ more people if the goods produced by their existing set of workers itself are not being sold completely? Skilling the workers, another component of the ELI scheme again, is just going to create skilled unemployed workers under such conditions. All in all, the government is merely providing a palliative in the form of the ELI schemes instead of giving the unemployment problem the seriousness it deserves.
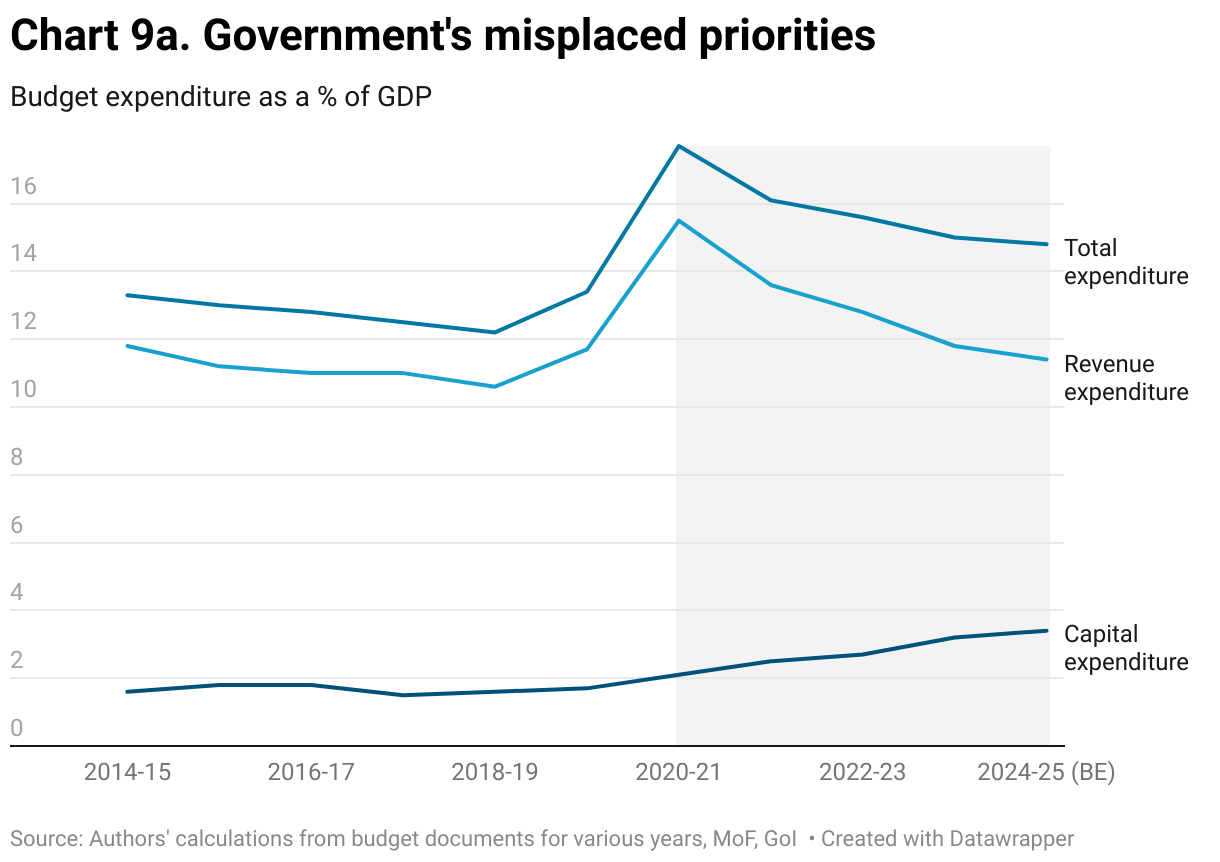
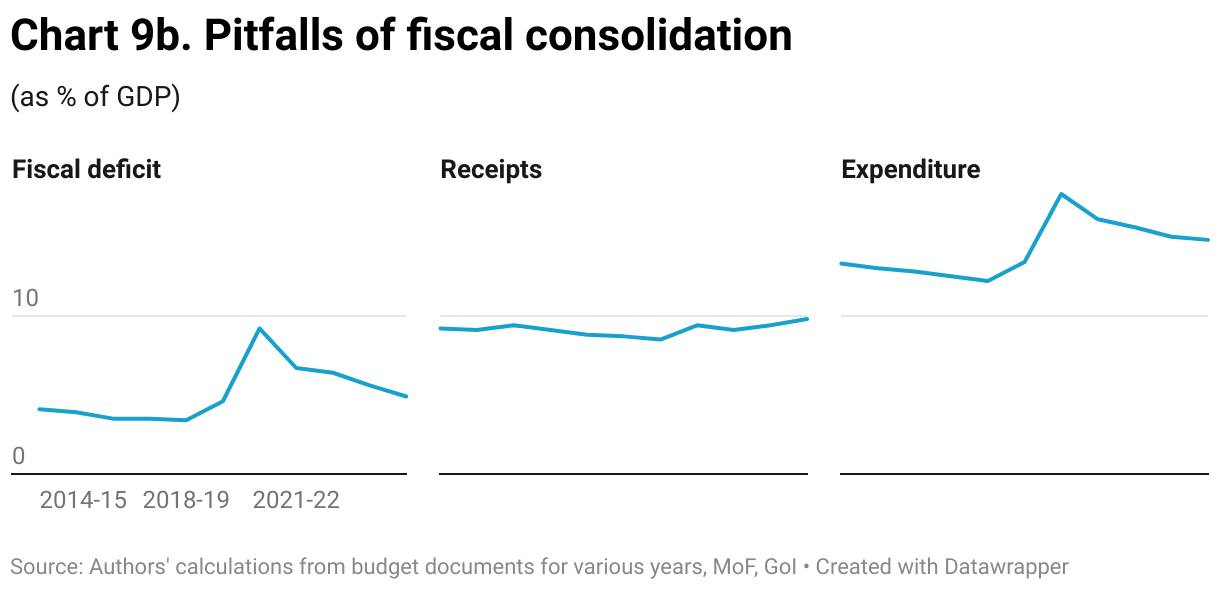
That the government is completely off the mark on the demand front becomes clear if one looks at its budgetary expenditure. Total expenditure, instead of rising to create additional demand, has been falling as a percentage of the GDP since 2020-21 (chart 9a). And, more significantly, this fall is happening entirely at the cost of revenue expenditure (exclusive of interest payments), the component which, in all likelihood, has a higher potential of creating jobs. And why has the expenditure fallen? Because the government wants to control its fiscal deficit. With receipts (tax and non-tax) stagnating (as a % of GDP), the only way the deficit can be brought down is by decreasing expenditure (chart 9b).
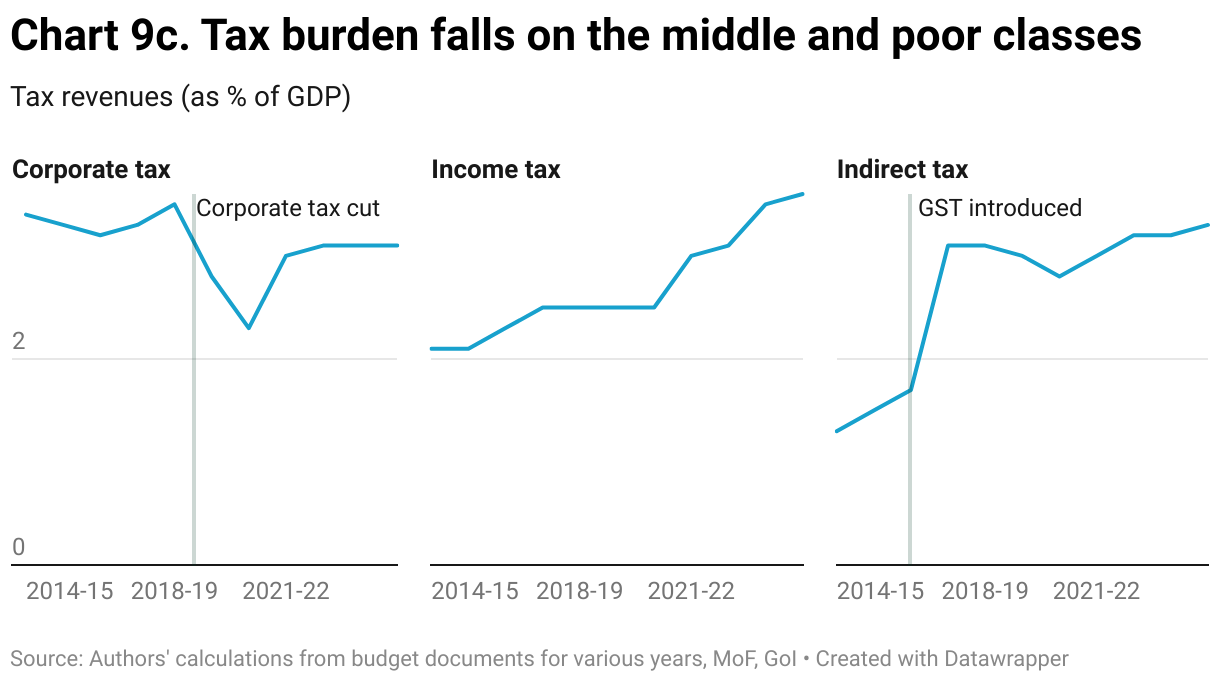
Even on the receipts side, the situation has been made worse on the demand front. With the dramatic corporate tax cuts, the corporate sector contributes less than the income tax payers to the government’s tax kitty (chart 9c). Not just the middle class, the government’s excessive reliance on GST has burdened the poor as well. According to this Oxfam report, the poorest half of the Indian population pays almost two-thirds of the total GST revenue, whereas the richest 10% pay just three to four per cent of this total. This form of tax collection is akin to taking from the poor and giving it to the rich, instead of the opposite. While this is regressive in itself, it further aggravates the demand problem. The poor and the middle class, as compared to the rich and the corporates, have a higher propensity to consume out of their income. Mobilizing more taxes from them, instead of from the rich, means sucking potential consumption demand from the economy. Moreover, such tax breaks and incentives to the corporate sector have not revived corporate investment, so why continue with them? Why not give the opposite strategyhigher corporate taxes while reducing income taxes and GST ratesa chance? By increasing demand in the economy, thereby starting a virtuous cycle of economic expansion, such a strategy may actually end up increasing private investment as well. This brings us to a discussion of what the government should have done in Budget 2024.
What could have been done?
This budget required, more than ever, the government to look at every step, whether on the receipt or the expenditure sides, through the lens of emphasizing demand and creating jobs.
1. Tax policy: Let’s start with the receipts side. Even if they wanted to control the deficit, rising receipts with rising expenditure (at a slower pace) would have done the same job. On the tax side, the following things could have been done:
1.1 Create an additional tax slab for incomes above Rs 10 crore with a higher marginal tax rate, say 35-40%, while providing lower tax rates at the lower end of the income spectrum. It would have hit two targets with one arrow. With the current high concentration of income at the top, this step would have increased the tax revenue while providing respite to the middle class. On the other hand, this would have increased consumption demand because those who would have got a tax break have a higher propensity to consume (and on domestically produced goods) than those whose marginal tax rates had increased. It addresses the obscene levels of inequality as well as helps create demand and jobs in the economy.
1.2 Increase corporate tax rates along with lower GST rates: instead of pushing the burden of revenue mobilization onto indirect taxes, which burden the poor disproportionately, corporate taxes should have been increased. A corporate tax cut to induce higher investment should have been a result-oriented policy in the first place. We should simply go back to the earlier rates after a certain grace period. In this instance, four years is a long enough grace period. A lower GST, on the other hand, would have put more money in the hands of the poor, who would have spent a part of it on consumption. A lower GST would have also given them respite from rising prices.
1.3 Introduce a wealth and inheritance tax for those at the very top: it’s well documented that wealth inequality in India is even worse than income inequality and has worsened over time. A dissaving at the bottom and high savings at the top, especially after the pandemic, have contributed to this trend. Oxfam reports, “At the opulent margins of society, the most elite 1 per cent owns more than 13 times the wealth owned by the bottom half of the society, with nearly 40.6 per cent of the total wealth in India.” Bharti (et al.), writing for The India Forum, further break this down to show “the total wealth of the top 0.001% (less than 10,000 persons) is nearly 3 times the total wealth held by the entire bottom 50% (46 crore individuals)”. They have estimated the revenue a wealth-based tax would yield. Even in their baseline scenario, with 2% wealth tax and 35% inheritance tax 3This is a one-time tax and levied only when wealth is bequeathed, so its contribution to annual stream of revenue, they emphasize, is quite limited. Their argument for an inheritance tax comes from the fact that it “would directly tackle the unfair advantage that unearned dynastic wealth renders to individuals solely based on the accident of birth.” for those with a net wealth of more than Rs. 10 crores, this would yield additional tax revenue to the tune of 2.73% as a proportion of the GDP. And the good part is, given the level of wealth inequality, a high tax threshold of Rs 10 crores affects only 0.04% of the population, leaving 99.96% of the population untouched by this tax.
2. FRBM policy: The FRBM Act should be kept in abeyance till the economy has fully recovered. Fiscal consolidation in times of a slowdown (or early recovery) is counterproductive because it makes the policy pro-cyclical instead of countercyclical as required for a revival of the economy. Let’s say the revenue (tax and non-tax) is some 10% of the GDP, then adhering to an FRBM target of 4%, the total expenditure gets tied to the level of the GDP (in this instance 14% of the GDP to be precise). So, fiscal expenditure moves in the same direction as the GDP, the exact opposite of what it is supposed to do to act as a counterweight to slowing GDP. If the GDP growth needs to be revived, we need levers which act in the opposite direction, hence, the FRBM needs to be kept in abeyance till the economy is out of the woods.
3. Expenditure policy: Given the prolonged demand problem in the economy, we first need to acknowledge that now is not the time to cut revenue expenditure at the cost of the capital expenditure or vice versa. Moreover, it’s not just the quantum, the nature of expenditure matters too. For example., we have increasingly moved away from public provisioning to insurance-based budgetary allocation (Ayushman Bharat, fasal bima yogana etc) on the revenue expenditure side. On principle, there needs to be a change in this model of fiscal expenditure. With higher tax revenues and FRBM in abeyance, a lot of room opens up for both types of expenditures, which will create both capacity and immediate mass demand in the economy. In fact, we need to think of a comprehensive policy, which organically combines the two components. One such proposal has been made here (co-authored by one of us) in the form of an Indian Green Deal. We elaborate below.
3.1 Capital expenditure: While capital expenditue of any kind generates capacity (and demand), we need to think outside of the usual road-airways infrastructure-led capital expenditure. With the impending climate crisis, which would require adaptation measures (to deal with disasters like untimely floods, heat waves, cyclones, and droughts in different parts of the country; adversely affected cropping patterns) as well as mitigation efforts (creating a green energy system), we need to rethink the capital expenditure we need. Estimates tell us that an additional 1.5% of GDP is required to change the energy mix of the economy. A specific green capital expenditure policy along these lines needs to be built, which can be separately financed by a carbon tax-dividend policy as enumerated here. Such a capital expenditure policy has another plus point — its employment elasticity. Spending a rupee in building green energy infrastructure will generate almost 2.5 times more jobs than the fossil fuel sector.
3.2 Focus on the Care economy: Our healthcare system was tested during the pandemic, and it failed miserably. We seem to have adopted the American model of insurance-based private healthcare, which is not only quite expensive but is ineffective as well. The State, too, is gradually moving away from public provisioning of health to insurance-based healthcare spending. We need to replace this model with an affordable and good-quality public healthcare for all the citizens. Much like health, education has not got the attention it deserves. No country has ever developed without an educated population. India needs to focus on education even more, given the demographic dividend we have. Increasing school enrolment, skilling workers, encouraging critical thinking through the social sciences, and cutting edge research in science and technology, there is no end to the list of what we need to do. To be sure, for a task as big as this, the private sector will have to play its role too but the State has to lead it from the front if we are not to lose our demographic dividend.
3.3 A National Urban Employment Guarantee Act (NUEGA): While both the expenditure components discussed above — green capital expenditure, and the care economy —will generate decent jobs, we do not believe it will be enough to absorb the surplus labour employed in agriculture. The State needs to be the employer of last resort in such a situation. There has been a discussion around having an urban counterpart of the NREGA, with special focus on youth and women, which needs to be taken with utmost seriousness.
In conclusion, unlike many budgets, this was an important budget both for political and economic reasons. On the political front, it needed to reassure the electorate that the government had read the mandate correctly. On the economic front, it needed to take the unemployment-bull by the horns. Unfortunately, the government seems to have frittered that opportunity away.
Rohit Azad teaches economics at Jawaharlal Nehru University. Indranil Chowdhury teaches at PGDAV College, Delhi University.

