

The much-awaited household consumption expenditure survey 2022–23 (HCES) was recently released. While a brief fact sheet based on the HCES was released in February this year, the release of the detailed report and the unit-level record had to wait until after the Lok Sabha elections. A thorough analysis of the HCES using the fact sheet can be found here.
Household consumption expenditure surveys are used to estimate consumption-based poverty and inequality levels and trends, and to update the consumer price indices. Data on household consumption was collected annually from 1950–51 to the early 1970s and once every five years from 1972–73. These surveys are extremely important for policy and research.
In a first, the survey conducted in 2017–18 was junked by the government because of alleged “data quality issues”. Before that, the survey was conducted in 2011–12. Hence, no consumer expenditure data was available for over a decade to assess the impact of the economic slowdown, demonetisation, Covid-19 and lockdowns, and other policy changes.
The unit-level record of HCES 2022–23 was expected to finally end the data drought and facilitate reliable poverty estimation. However, a preliminary analysis […] suggests that this data may not answer all such questions.
In the absence of official household consumption data, research on poverty relied in the interregnum on other data sources, reaching varied conclusions. A summary of recent poverty studies noted that the estimates of the absolute number of people below the poverty line varied from 34 million to 373 million, depending on the data source and methodology.
The debate on poverty estimates since 2011–12 was referred to as the Great India Poverty Debate 2.0. A review of recent poverty estimates can be found here and here. Several researchers noted that an important aspect of the Great India Poverty Debate 2.0 was the lack of credible data on household consumption expenditure.
The unit-level record of HCES 2022–23 was expected to finally end the data drought and facilitate reliable poverty estimation. However, a preliminary analysis of the HCES 2022–23 suggests that this data may not answer all such questions. This article discusses some preliminary findings from the latest survey and weighs in on the question of comparability and quality of the survey.
Survey methodology and comparability with previous surveys
The HCES was conducted between August 2022 and July 2023, covering 2,61,746 households. There are several changes in the 2022–23 survey methodology compared to the previous survey held in 2011-12, starting from its name. The new survey is called the Household Consumption Expenditure Survey, as opposed to the earlier Household Consumer Expenditure Surveys; but there is more.
The HCES was conducted in three visits instead of a single visit in the previous rounds. The HCES questionnaire is divided into four parts: the HCQ collects information on household characteristics, the FDQ collects information on food items, the CSQ collects information on consumables and services, and the DGQ collects information on durables. In the first visit, the HCQ was canvassed along with one of the FDQ, CSQ and DGQ. Two more visits were made to the household to collect the information on the remaining schedules.
Like the previous surveys, the HCES follows a multi-stage stratified random sampling. However, there are differences in how the village/blocks and households to be surveyed are identified.
The NSSO surveys first identify the villages and urban blocks from which households to be surveyed are selected. These villages/urban blocks are known as the First Stage Unit (FSU).
The HCES has a new strategy to identify villages for the rural samples. It ensures that a certain proportion of the rural sample is from the villages close to the urban areas. This was not the case in the previous rounds. It is safe to assume that villages closer to the city centre or the district headquarters would be relatively more affluent than the remote ones.
Once the villages/urban blocks are identified, the next step is to identify the households for the sample. The HCES employed a different strategy for this, too.
For each selected village, the population is divided into three strata depending on the size of landholdings. In urban areas, the population in the block is divided into three strata depending on the value of cars owned. Eighteen households are surveyed from each selected village/urban block.
This strategy lumps the (roughly) bottom 85% of households in terms of landownership in rural areas and those without a car in urban areas into one category, from which households are to be selected for the survey at random.
Not all households not owning a car or owning less than a particular area of land have the same economic status. However, a large proportion of such households form one group and compete for selection in the sample.
There seems to be no mechanism in the survey design to ensure that the poor – say, someone belonging to the bottom 10 per cent of the population in rural/urban areas will make it to the sample. While the survey design does not explicitly exclude the poorest from the sample, it reduces the probability of the poor making it to the sample.
An example may make this clear.
Suppose an urban block with a population of 50,000 is selected to be surveyed. Suppose 4% of the households in the block have a car worth Rs 10 lakh or more, 10% of households have a car worth less than Rs 10 lakh, and 86% of the households own no car.
That is, out of the 50,000 households in the block, 2,000 households own a car worth more than Rs 10 lakh, 5,000 households own a car worth less than Rs 10 lakh, and 43,000 households own no car.
The survey design mandates that 18 people be selected from the urban block, and the three strata must be represented in the sample according to their population proportion. Rounding off the decimal points, this implies that of the 18 households to be surveyed, one household should have a car worth more than Rs 10 lakh; 2 households should have a car worth less than Rs 10 lakhs; and 15 households should not own any cars. 14 per cent of 18 gives a value of 0.72, which, on rounding off, comes to 1. Similarly, 10 per cent of 18 comes to 2, and 86 per cent of 18 comes to 15. Now, 15 households are randomly selected from amongst 43,000 households who do not own a car. The probability that the households living in extreme poverty will be surveyed is small unless efforts are made to ensure that the poor are part of the sample. The documents released with the HCES data suggest that no such steps were taken to ensure the participation of the poorest in the sample.
The changes in the HCES methodology make the surveys non-comparable with previous rounds in the present state. They also raise questions of an implicit bias that may exclude the poor households, which may continue in future rounds if the survey methodology remains unchanged.
If the extremely poor households are not a part of the sample, the monthly per capita expenditure estimates would be higher by design. 2A similar concern was raised by Santosh Mehrotra and Rakesh Ranjan Kumar in this article earlier.
In the 2011–12 round, the stratification at this level was done based on the relative affluence of the households, and there was a mandate to pick a certain number of households from each segment. For instance, 25% of urban households in the sample came from the bottom three monthly per capita expenditure deciles.
While the HCES has made a greater effort to sample the affluent households, it does not come anywhere near to capturing the consumption of the elite. By lumping all the households that own a car worth over Rs 10 lakh in one stratum and selecting indiscriminately from that, the survey does not differentiate between the super-rich owning multiple luxury cars and a private plane and a salaried employee who has bought a Rs 10 lakh car on EMI.
While it is undoubtedly challenging to survey the super-rich, it is not impossible to conceive of a survey design that better reflects the social and economic reality of the times. The Survey of Consumer Finance in the US is one example that captures the income and wealth of the elite because of a conscious effort to sample the super-rich.
The changes in the HCES methodology make the survey non-comparable with previous rounds in the present state. They also raise questions of an implicit bias that may exclude the poor households, which may continue in future rounds if the survey methodology remains unchanged.
What does the data tell us about poverty and inequality?
With the caveats of non-comparability and potential exclusion of the poorest households from the sample, let us see what the data shows. The average monthly per capita expenditure in rural areas is Rs 3,773, Rs 6,459 for urban areas, and the national average is Rs 4,534.
Updating the Rangarajan poverty line for 2011-12 by the Consumer Price Index (Rural and Urban) shows that the poverty headcount ratio in rural India was 8.3%, 7.3% in urban, and about 8%overall in 2022–23.
While some have argued that India has abolished extreme poverty, the HCES shows about one-third of India’s population survives on less than Rs 100 a day.
However, as discussed already, a meaningful comparison of poverty trends is not possible for several reasons, including changes in the sampling methodology. Given the change in consumption basket between 2011–12 and 2022–23 and the several critiques of the poverty estimation methodology, perhaps the best route would be to form (yet another) Expert Committee to do a thorough exercise and come up with a credible poverty line.
While some have argued that India has abolished extreme poverty, the HCES shows about one-third of India’s population survives on less than Rs 100 a day (Table 1). Rs 100 per person per day may not be enough to buy two square meals and a water bottle in a city, let alone cover rent, travel, health and education.
Table 1
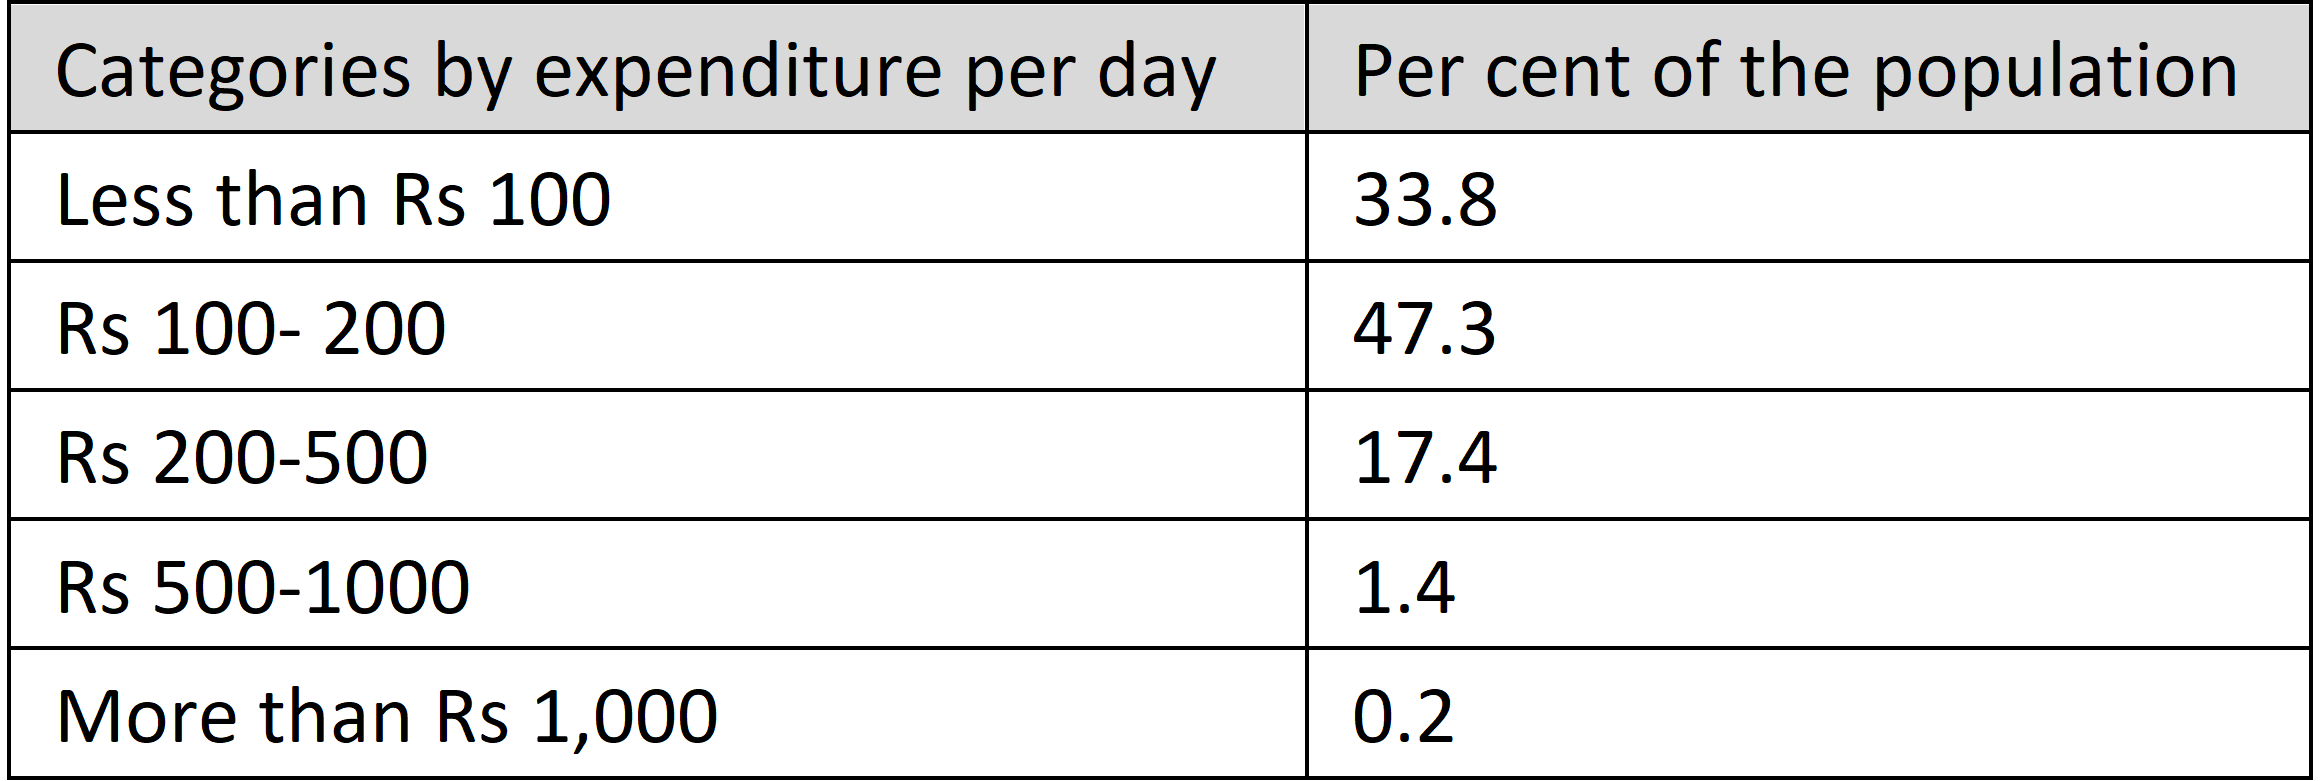
On the other hand, 0.2% of the population spends more than Rs 1,000 per day.
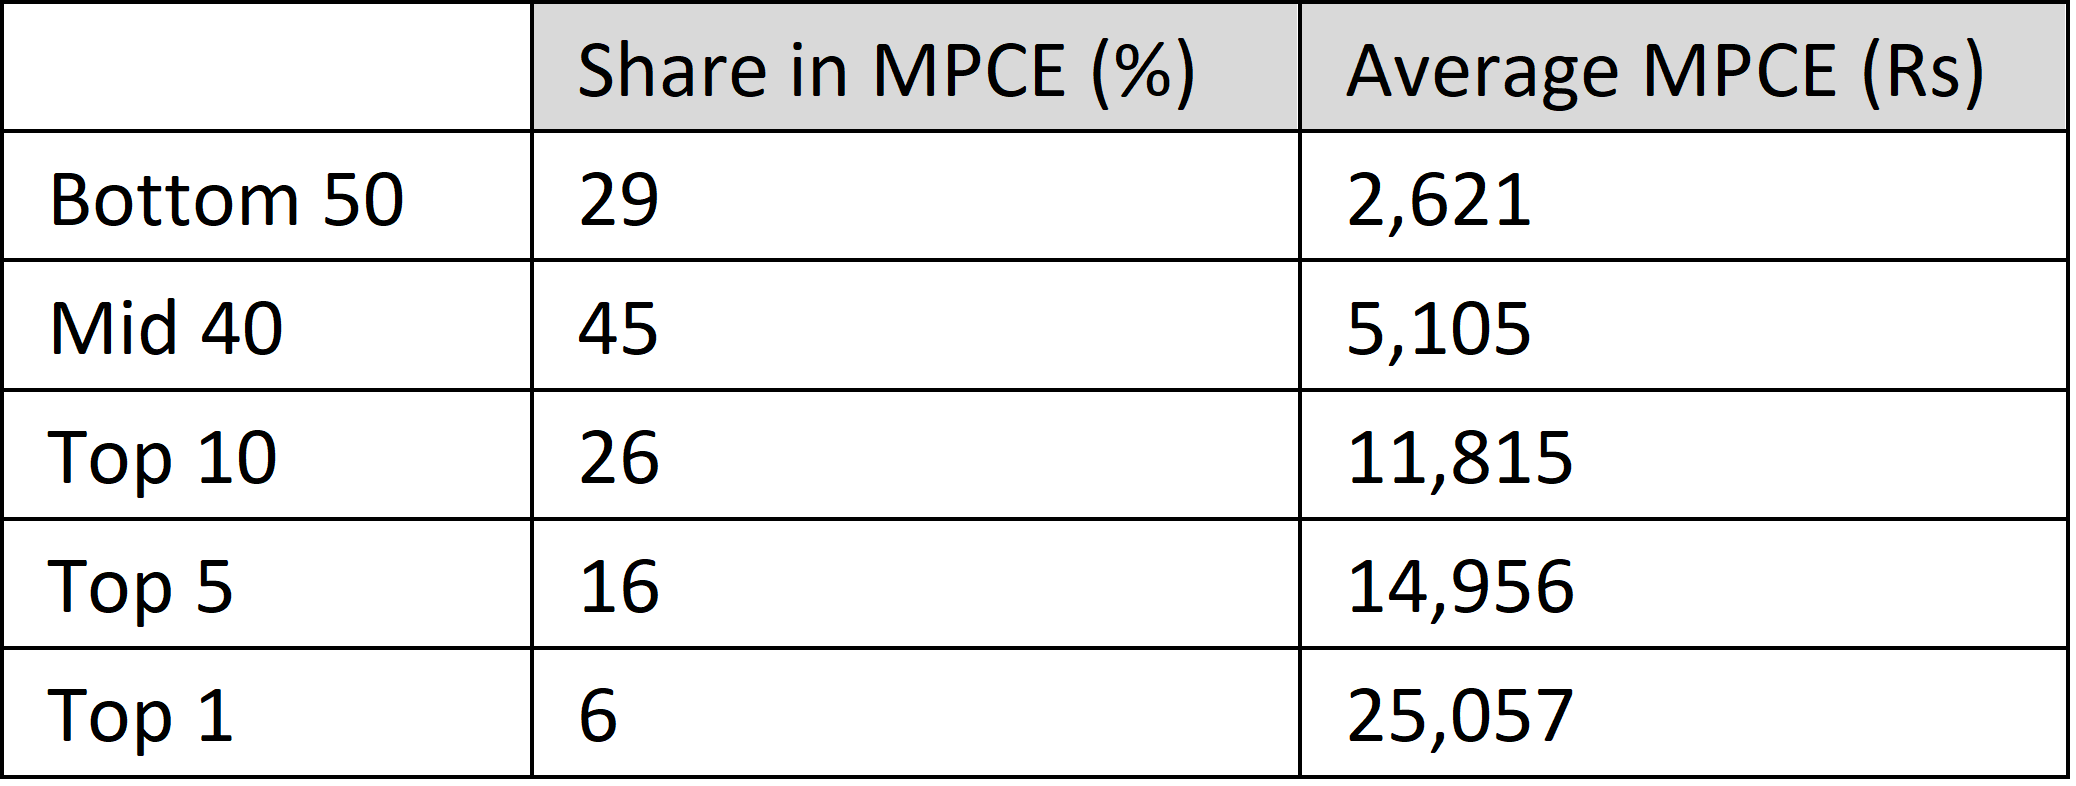
The average monthly per capita consumer expenditure of the bottom 50% of the population was a paltry Rs 2,621 (Table 2). The average expenditure of the top 1% was about Rs 25,000 per month per capita, which is undoubtedly a gross underestimation. The share of the top 1 per cent in consumption expenditure in HCES was about 6 per cent, again, a gross underestimation considering that the income shares of the top 1 per cent was over 22 per cent and their wealth share was over 40 per cent for the same year (Bharti et al, 2024).
Table 2
Access to amenities and central schemes
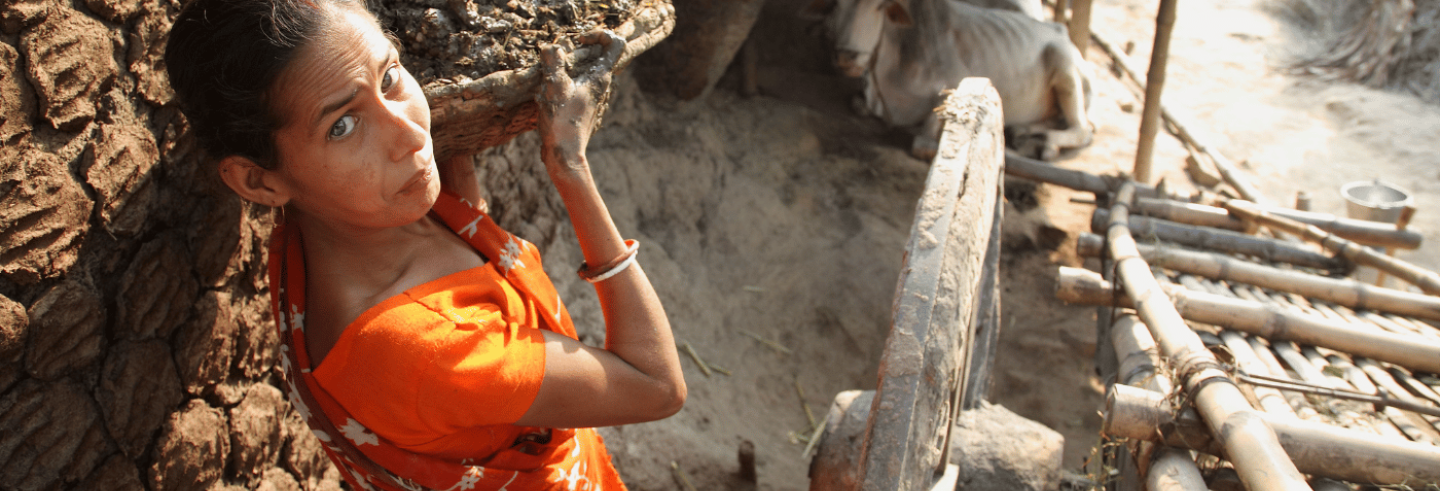
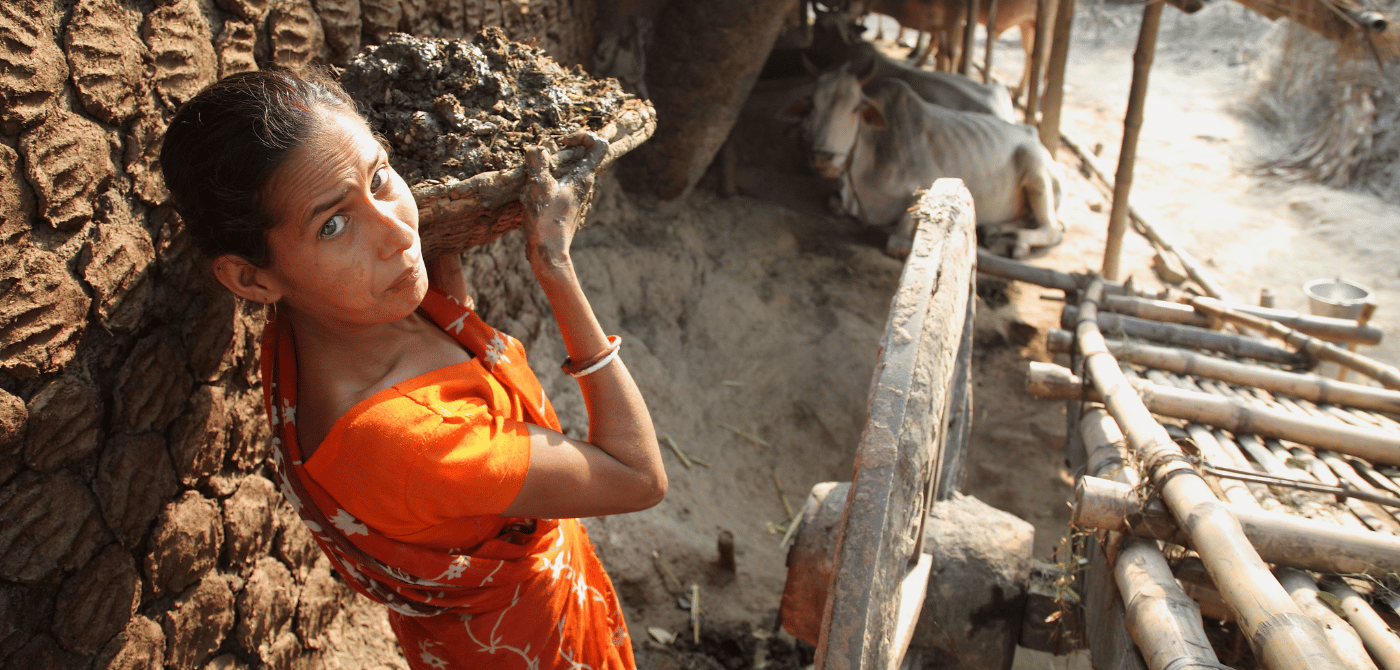
The data on access to amenities does not affirm the rosy picture painted by the economists claiming a poverty-free India. The data shows that over 40%of the population used firewood/dung cake as the primary source of energy for cooking. About 18% of the rural population had no access to toilets in 2022–23, notwithstanding the grand claims about all states being open defecation-free in 2019.
The HCES also collected data on Pradhan Mantri Garib Kalyan Yojna beneficiaries, including the Pradhan Mantri Garib Kalyan Anna Yojna (PM-GKAY). Under the PM-GKAY, an additional 5 kg of food grains per month was distributed to the Antyodaya Anna Yojna (AAY) and Priority Households (PPH).
About 18 per cent of the rural population had no access to toilets in 2022-23, notwithstanding the grand claims about all states being open defecation-free in 2019.
The National Food Security Act covers up to 75% of the rural and 50% of the urban population under the AAY and PPH, and the PM-GKAY should cover this population. The data on recipients of PM-GKAY shows a much smaller coverage. Only about 55% of the rural population and 29% of the urban population reported receiving any benefits from the Pradhan Mantri Garib Kalyan Yojna, including the PM-GKAY.
Conclusions
The sampling methodology of the HCES needs to be critically reviewed before credible claims can be made using this data. Nonetheless, the HCES reaffirms that the administrative data on access to toilets and LPG use does not square with the survey data. The data also shows a large proportion of the population survives on very little. And if this is at odds with the poverty line, maybe it's time to revisit the poorly designed poverty line. It is also time for the survey design to be reconsidered to capture the fortunes of the elites, which significantly impacts the consumption pattern in the economy. The data also needs to be thoroughly analysed to understand and correct the exclusion errors for important and ongoing schemes such as the PM-GKAY.
(PC Mohanan, formerly of the CSO, has pointed out (see comment below) that the example given above of the sample frame/sample design followed by the NSS is not a correct one. The author thanks PC Mohanan for pointing this out. However, the larger argument about the 2022-23 survey being non-comparable with earlier ones and of the survey being potentially exclusionary remains valid.)
Ishan Anand teaches economics at IIT Delhi.
The author thanks Professor Sourabh Paul for discussions related to the HCES and the Ministry of Statistics and Programme Implementation for organising the Data User Conference.


Sample design