1. Introduction
The proximity to national elections has energized and politicized the debate over poverty in India. This is to be expected as the current government completes a decade in office, a natural milestone, to take stock of the state of the economy and how the poorer sections are doing. The debate is more heated than usual because of data-related controversies. The last detailed consumer expenditure survey that was published by the National Statistical Organisation (NSO), with poverty lines defined on the basis of current cost of living and expenditure patterns, as is the usual practice with each round of these quinquennial surveys, was in 2011-12. The 2017-18 report was never published, and analysis based on a leaked version (Subramanian, 2018) suggested not only an increase in poverty but, also, a downward shift in the entire distribution of consumer expenditure.
Given the absence of household level consumer expenditure survey (CES) data, over the last few years researchers have used the National Accounts Statistics (Bhalla et al, 2022), CPHS data collected by CMIE (Roy and Van der Weide, 2022), and more recently, the Periodic Labour Force Survey (PLFS) data (Ghatak and Kumar, 2024, Himanshu et al, 2024) to come up with synthetic estimates of poverty. The poverty data published by the World Bank is based on Roy and Van der Weide (2022). The estimates across these studies vary widely, and the subsequent debate about the relative pros and cons of these approaches has been dubbed The Great Indian Poverty Debate 2.0 (see the e-Symposium on “Estimation of Poverty in India” in Ideas for India, 2022).
Now, a “Fact Sheet” was published by the Ministry of Statistics and Programme Implementation in February, less than two months before the general elections, providing some summary statistics about consumer expenditure levels based on the 2022-23 NSO Household Consumption Expenditure Survey (HCES). This has given fresh impetus to the poverty debate. In the absence of detailed survey results, as well as freshly calculated poverty lines based on updated cost of living and consumer expenditure patterns, it is not possible to come up with updated poverty estimates that are truly comparable to the 2011-12 round data.. However, it enables provisional estimates of the headcount ratio of poverty on the basis of poverty lines from the 2011-12 survey, which are updated by the average inflation rate. This suggests a very sharp decline in poverty (e.g., Subramanian, 2024, Rangarajan and Mahendra Dev, 2024, Bansal, Kumar, and Panda, 2024).
The previous CES data was published in 2011-12 when India’s poverty headcount was estimated at 23% in 2.15 PPP dollars per-day (i.e. adjusted for cost-of-living differences). Using the Tendulkar line, it was 21.9%, while with the Rangarajan line it was around 29.5%. 1We are reporting the official headcount ratio that used the MRP method. It should be noted, as Subramanian (2024) points out, if the Tendulkar line is calculated based on the MMRP method, as opposed to the MRP method, then the poverty rate in 2011-12 was 15%. Provisional estimates of the poverty rate based on average consumer expenditure levels across different expenditure groups in 2022-23 are in the 3-5% range if one takes the more conservative Tendulkar line of poverty, while estimates using the Rangarajan line fall in the 8-11% range.
So, what these provisional estimates suggest is that this is the largest decadal drop in extreme poverty, narrowly beating out the previous largest drop in poverty over a comparable period, which happened between 2004 and 2011.
These estimates are tentative until unit-level data is released, and researchers as well as the NSO itself have noted (e.g., Mehrotra and Kumar, 2024) that due to some methodological changes, one has to exercise caution in comparing the current CES with the earlier CES rounds (e.g., change in item coverage with inclusion of new items and merging some of the obsolete items, and changes in the questionnaire of the survey). Moreover, the latest data reveals that there have been some changes in consumption patterns between 2011-12 and 2022-23, which will require an updated set of weights in the calculation of the Consumer Price Index for this period, as well as a new national poverty line.
A few decades ago, even contemplating such an achievement was unthinkable. More than half the population was below the national, or international, poverty lines. With India’s impressive economic growth since liberalization, poverty declined rapidly (see Deaton and Kozel, 2005). To the extent these numbers do suggest a sharp decline in extreme poverty over just one decade, the natural question is how did that happen?
A basic but important feature of the process of economic development is that as a country becomes richer, the fraction of its population living in poverty is expected to decline. Therefore, to continue to pull people out of poverty, an economy needs to mobilize its productive forces continuously to drive economic growth. The per-capita income of India is around $2,400 as of 2022-23. Far better than $300 in 1991-92, but still distant from the world average of $12,500 which is reflected in the fact that its ranking among countries in terms of per capita GDP has not changed very much.
To the extent these numbers do suggest a sharp decline in extreme poverty over just one decade, the natural question is how did that happen?
Growth is certainly a necessary requirement for long-run poverty reduction. A natural implication is low growth is less effective than high growth in terms of reducing poverty and this is borne out by India’s experience in the post-liberalization era (see Tables 1 and 2 below). However, growth is not sufficient. Growth impulses need to transmit across different sectors of the economy, as opposed to being concentrated in urban enclaves where only the relatively well-off benefit. The long-term process of economic development involves not just growth, but is accompanied by structural transformation through which workers move to more productive sectors, specifically from agriculture to manufacturing and services. Of course, public policy plays a role as well. Social safety-net policies can help reduce poverty directly, and expansion of infrastructure, better public services enable the poor to take better advantage of opportunities.
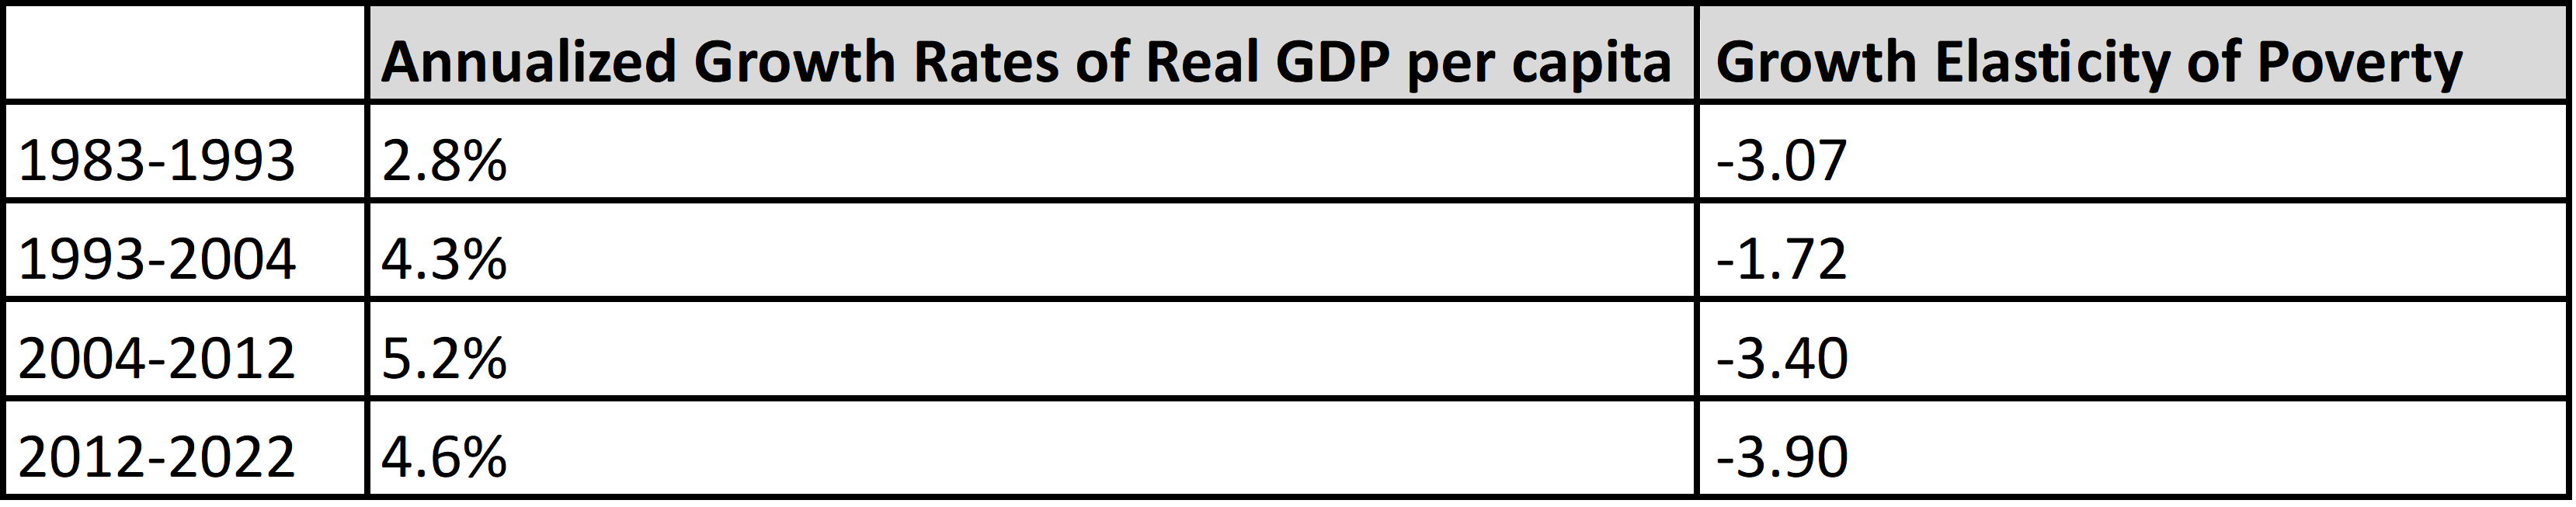
If we look at the poverty numbers (Table 1), and the corresponding annualized growth rates of GDP per capita between subsequent rounds of the NSO consumer expenditure surveys (Table 2), we can compute the growth elasticity of poverty (GEP), i.e., the percentage reduction in poverty rates associated with a percentage change in per capita income. As we can see, the 2004-2012 period was, so far, the period where the growth rate of per capita GDP was the highest and, the drop in poverty in percentage points was the highest, giving the highest growth elasticity of poverty until 2012. In the last decade, the growth rate of per capita GDP was good but did not stand out, yet the drop in poverty has been very sharp, giving the highest GEP over the last four decades.
Table 1: Poverty rates since 1983
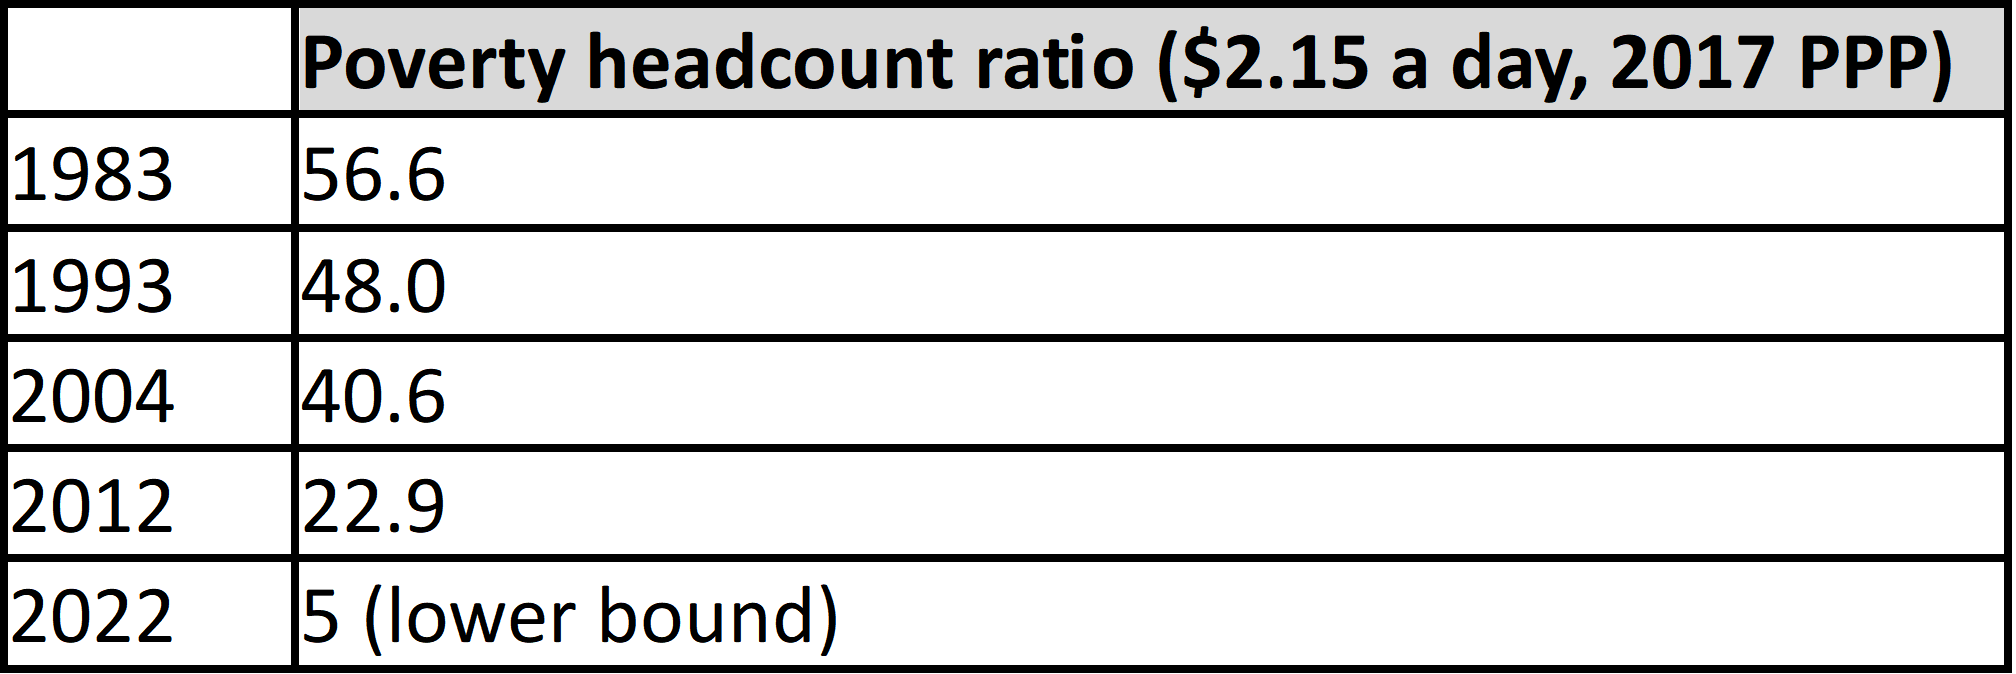
Table 2: Growth rates of the Indian economy
In the next few sections, we analyze the decline in Indian poverty over the last decade.
Our main goal here is to figure out whether poverty reduction can be explained by one of the following three factors: first, the general trickle-down effects of economic growth; second, an expanded social safety net; third, the role of inflation (since without adjusting the Consumer Price Index to newer weights and spending patterns, mechanically applying the average consumer price inflation rate to poverty lines defined in 2011-12 could be misleading). Given data availability at present, we will not be able to say much on the second and third factors, but we believe they are likely to be important ones. .
In Section 2, we try and assess if these newly estimated levels of poverty are consistent with India’s level of development. In Section 3, we assess the currently available evidence in terms of what it is able to tell us about the level of poverty in 2022-23, and what it cannot; specifically, whether poverty declined continuously over 2011-23, or was a more sudden phenomena driven by exogenous circumstances. The conclusions are in Section 4
2. Poverty and the development process
Debates over trends in poverty are natural, as changes in poverty rates are linked to a government’s economic performance. It is useful to take a more long-term view of India’s growth process to understand the dynamics of poverty.
Leading scholars of economic development such as W. Arthur Lewis and Simon Kuznets have argued that the process of development involves not just growth of GDP but also structural transformation that raises overall productivity by reallocating resources from “old” to “new” sectors. As labour is the resource that constitutes the main source of living for the vast majority of the population, the process of structural change also raises the incomes of workers by reallocating them to higher productivity sectors. When this mechanism is sustained long enough, poverty automatically decreases, and per capita incomes become an order of magnitude higher.
Most poor countries are characterized by low rates of urbanization and a relatively high weight of agriculture in domestic output (or GDP) and employment. Economic historians have spilled much ink painstakingly identifying these structural shifts which are associated with industrialization: a movement of the agrarian workforce into more productive opportunities for employment in the manufacturing or service sectors. The economy modernizes by producing internationally tradeable goods, informal work and self-employment slowly gets absorbed into formal employment, and output per worker rises as labour is – in the words of Arthur Lewis – “fructified by capital.”
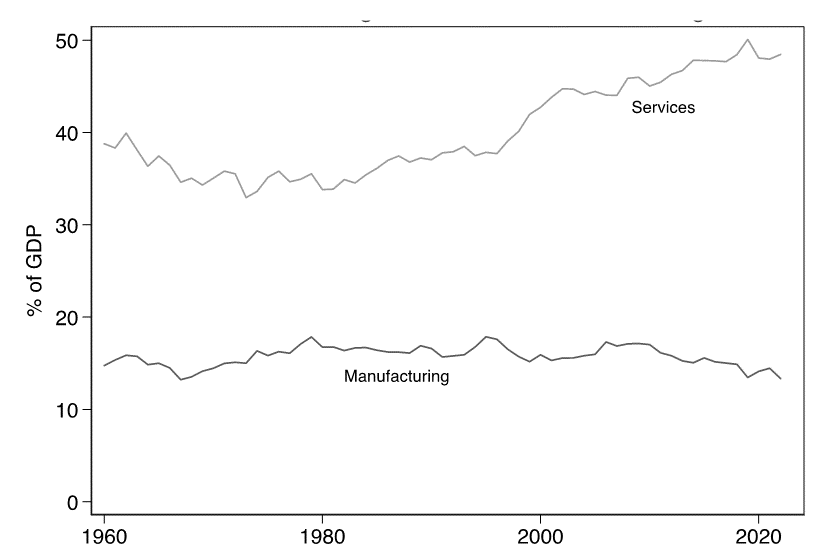
Given the framework of this transition, there is a puzzle about the Indian economy not just over the last decade but previous decades as well, as far as the decrease in poverty is concerned. While the 1991 liberalization put India on a faster growth trajectory, raising its rate of economic growth from the sluggish growth rates of the three decades, there is nothing remarkable in the evolution of the share of manufacturing in GDP. . Indeed, structural change in India has largely been driven by the service sector which has raised its share of GDP to nearly 50% in the last decade, while the share of manufacturing has been largely stagnant. To international observers this would come as no surprise as India is known for its export of high-end technological services. But at the same time, such services do not generate a high demand for labour in a relatively poor labour-surplus economy with less than stellar educational attainment. 2In an in-depth review of the Indian education system, Muralidharan and Singh (2021) posit that the Indian education system fails most of the population it serves, only succeeding in a filtration process to rank the best. Despite the increase in school access, the gap between expected and actual ability of students at any grade is large compared to other Asian countries (such as Vietnam). Its main beneficiaries are a small fraction of Indians who have high levels and a high quality of education, but it presents no panacea for lifting millions of Indians out of poverty. For this reason, India’s growth experience is often considered a classic case of “premature deindustrialization” (see Amirapu and Subramanian, 2015 and Rodrik, 2016).
Figure 1: Share of Manufacturing and Services in GDP (1960-2022)
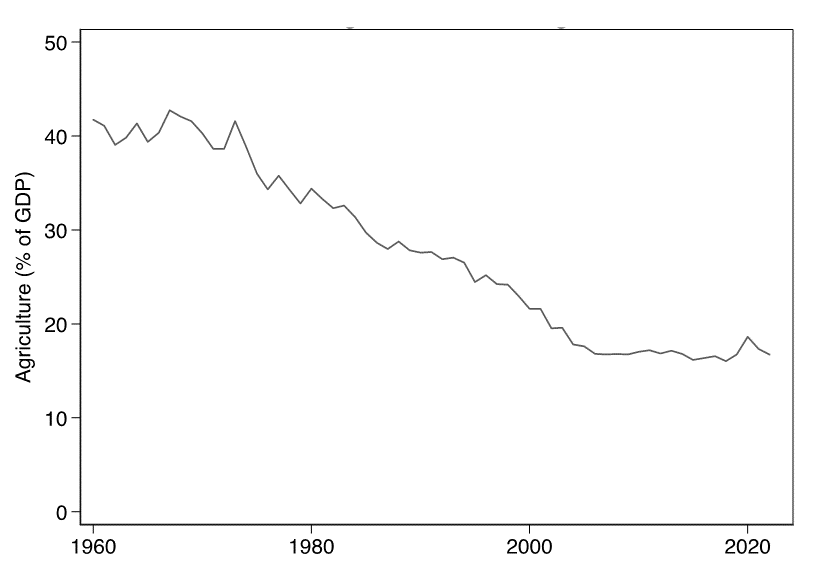
If we instead look at the share of agriculture, we observe two distinct patterns. On the one hand, the weight of agriculture in GDP has declined in the long run, as expected for an economy going through the process of development. But the decline of the share of agriculture seemed to stop by 2004, settling at around 15-17% of GDP over the next two decades until now. By way of comparison, agriculture now accounts for 7% of Chinese GDP, having a share of 13% two decades ago while starting with a proportion comparable to that of India in the 1960s.
Figure 2: Share of Agriculture in GDP (1960-2022)
This challenges our view about the expected path of structural transformation. Instead of growing by increasing the weight of the non-agricultural sectors, India’s growth model is reliant on shifting weights within the non-agricultural sectors (manufacturing-to-services). This variant of growth is beneficial to those employed in the higher-end services. By virtue of these beneficiaries being a small fraction of the population, a larger share of national income accrues to a few. This creates prosperity for the upper and middle classes of Mumbai, Delhi, and Bangalore, but makes little difference to the incomes of nearly half the workforce (46% according to the latest PLFS) that is still employed in agriculture, and more generally, to the 60% of the Indian population that still lives in rural India. 3India’s census has not been updated in 2011 when nearly 68% of the population lived in rural parts, but UN population projections put the rural population today around 62-64%. This hardly fits the description of inclusive growth.
Instead of growing by increasing the weight of the non-agricultural sectors, India’s growth model is reliant on shifting weights within the non-agricultural sectors (manufacturing-to-services).
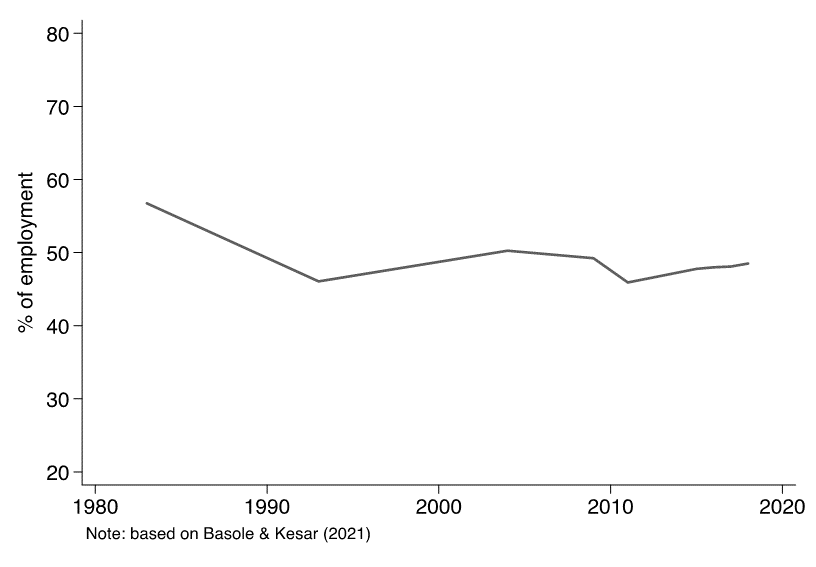
If we look at the corresponding pattern of employment across sectors, we see that agriculture’s share has marginally declined over the last two decades ,which, given the theoretical framework we described, is a positive development. However, the employment share of manufacturing has been completely stagnant, and the only positive trends are in the employment shares of services and construction. Moreover, if we look at the pattern of vulnerable employment (those who are own-account informal workers and unpaid family workers), this has not changed much over the last two decades. So, it is unlikely that the labour force released from agriculture is being absorbed in high-productivity sectors sufficiently fast.
Figure 3: Share of Agriculture in Employment
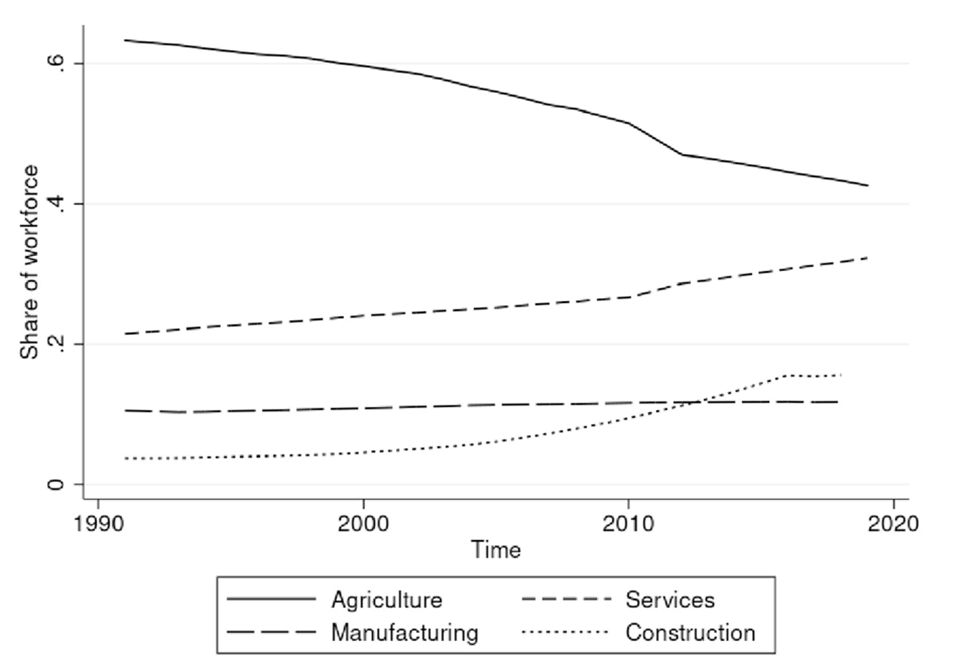
Figure 4: Share of Vulnerable Employment (own-account informal workers, and unpaid household helpers) in Total Employment
We can try putting India’s pattern of structural transformation and how it correlates with poverty reduction in the international context. Both history and theory predict that poverty will decrease as the share of agriculture declines. It is simply not common for economies to transition from low to middle-income status without shedding the weight of agriculture in total output. 4It is important to remember that a declining weight of agriculture does not imply falling incomes in agriculture. Instead, what usually occurs is that non-agricultural sectors grow faster than agriculture. Take the example of India’s neighbours in Asia, both geographically and in terms of economic growth in the recent era: China, Vietnam, and Bangladesh. All these countries have a lower share of agriculture in GDP relative to India today. Additionally, they follow a predicted path: the population in poverty declines alongside agriculture’s share of GDP. That is, agriculture’s share of GDP and headcount poverty are positively correlated.
Figure 5: Poverty and Agriculture Share – Comparison with Asian Countries
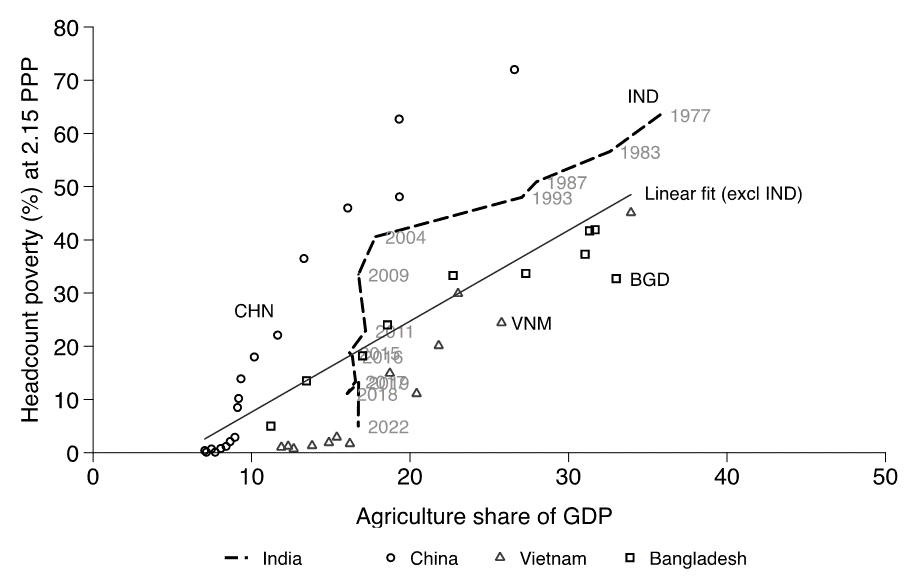
It turns out that India’s performance over the last decade breaks that trend. In the absence of the official household-level data on poverty, the World Bank made alternate estimates in recent years using private data, which we use here up to 2019 and use the 5% lower bound from the NSO fact sheet for 2022-23. These estimates suggest poverty in India fell over 2011-2019 but on the eve of the pandemic 10% of the population was still living on less than 2.15 PPP per-day. 5The World Bank’s Poverty and Inequality Platform provides estimates on Indian poverty based on recent research by Roy and Van der Weide (2022). These estimates have been criticized by researchers (see, for example, Drèze and Somanchi, 2023) because the alternative dataset after 2011 is a private survey with a well-known upward bias which flatters the poverty headcount.
We will revisit these estimates in a moment, but if take them at face value, then we are left with an awkward pattern suggested by Figure 5. Unlike the basic trends observed for the other three countries over 1980-2023, and the trend for India till 2011-12, headcount poverty dives vertically down at the same share of agriculture in GDP over the last decade. This suggests that something changed over the last decade in the relationship between the structural composition of the economy and poverty reduction. While this is based on correlation, not causation, it suggests that a better understanding of the circumstances driving trends in Indian poverty over the last decade is warranted.
3. Level and distribution of consumption expenditure: The 2022-23 NSO survey
With this backdrop, let us return to the 2022-23 HCES published in February 2024 by the NSO. This publication is India’s benchmark data to measure the living standard of Indians on a day-to-day basis and has a long history of publication going back to the 1950s. This particular edition is, however, clouded in a bit of controversy. First, it comes on the back of a previously retracted survey (the government cited quality issues) in 2017-18, which showed a marginal decline in per capita consumption levels across the board and a marginal increase in poverty relative to 2011-12. 6When a leaked tabulation was analyzed by experts (Subramanian, 2019), it was found that per-person consumption had fallen over 2017-18 and poverty was just as prevalent as it was in 2011-12. Second, despite a decade-long data ‘blackout’, the recently released fact sheet released less than a couple of months before the general election, provides some very basic summary tables without the full unit-level data or a report that comes up with new poverty estimates based on standard procedures followed by earlier surveys. The fact sheet suggests a highly positive picture of per capita consumption levels across the distribution. As we mentioned earlier, provisional calculations suggest a sharp drop in poverty,. Given this, doubts that the official authorities only release data which shows a positive picture cannot be dismissed until the full survey results are released and researchers have a chance to go through them carefully. 7For example, Anand and Kumar (2023) and Ghatak, Raghavan and Xu (2022) show that an out of turn 2018 official wealth survey showed declining wealth inequality. Anand and Kumar (2023), and more recently Bharti et al (2024) show that once the very rich are accounted for, wealth inequality has, in fact, gone up.
TABLE 3: Distribution of consumption by rural and urban classes
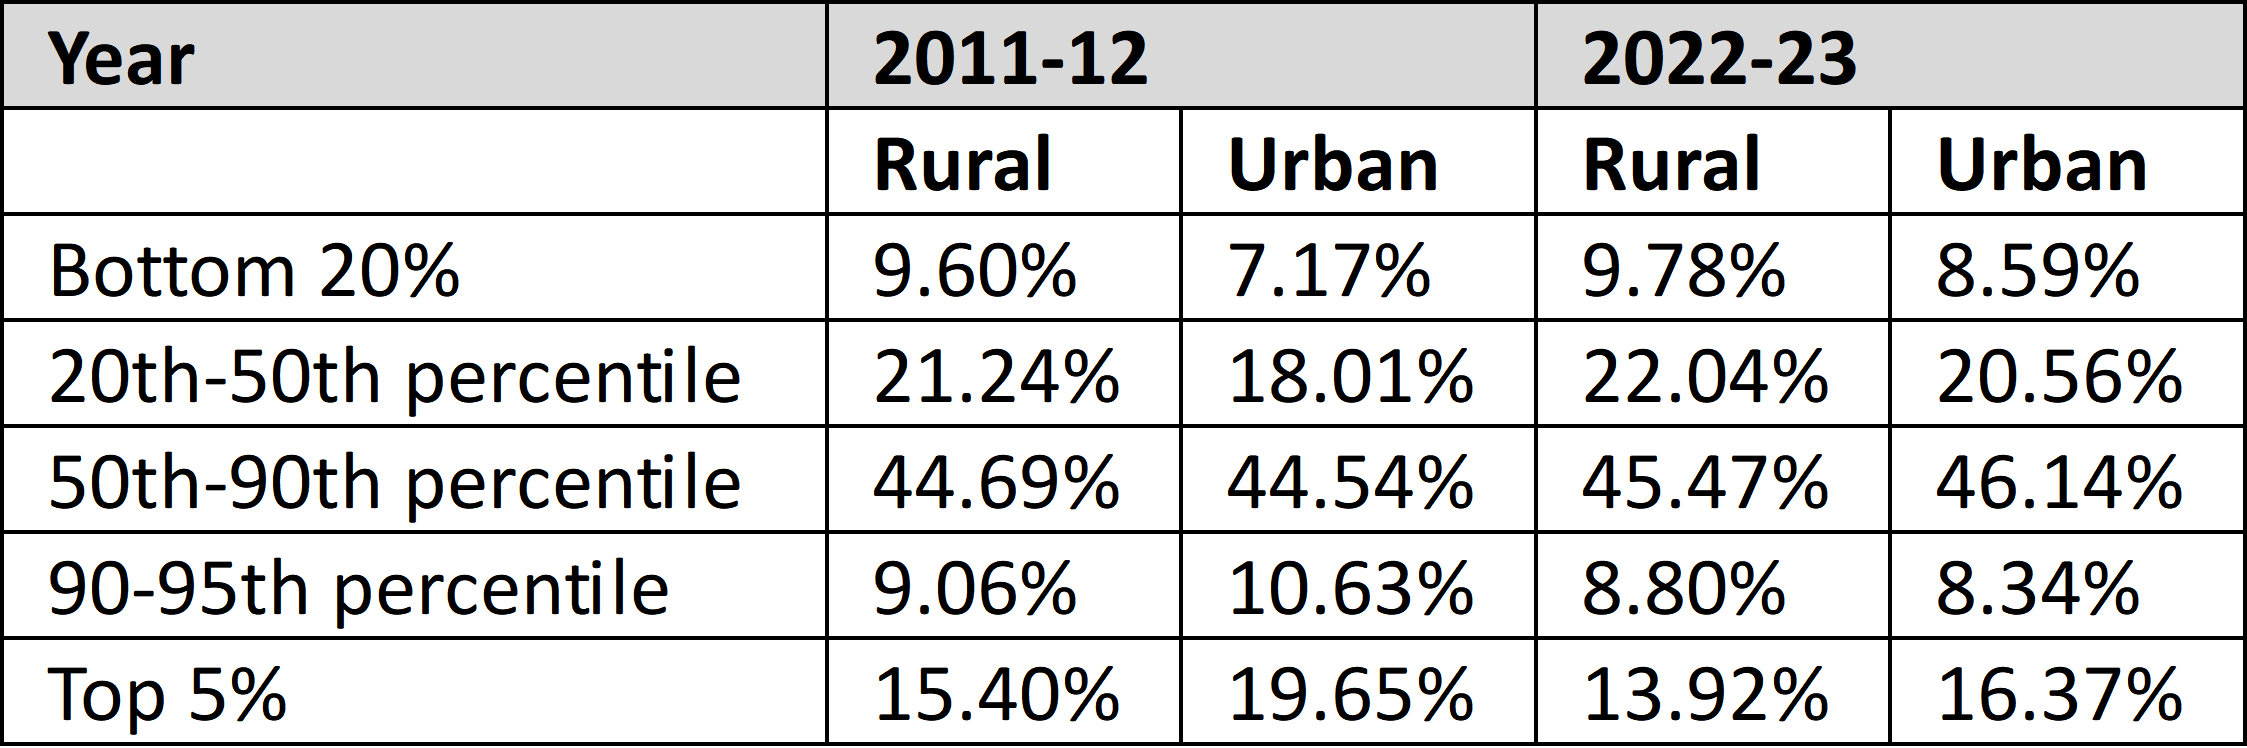
Still, for better or for worse, these are the data, and their findings warrant inquiry. We summarize the shares of the major classes in the rural and urban consumption distribution in Table 3. Surjit Bhalla –who has been arguing that the present government has been able to nearly eliminate extreme poverty well before these survey results were published – has used these numbers to argue that India eliminated poverty while simultaneously making the overall distribution more equal (Bhalla & Bhasin, 2024).
These claims look plausible when one looks at the shares of the bottom 20%, which did increase over 2011-23, while the rich took a smaller share of the pie. A basic problem here (other than what our discussion about the structural parameters of the economy suggests) is that these surveys are suitable for measuring the consumption of the poor, but not the rich. Sample surveys across the world, and in India, are simply unable to capture the ‘true’ rich due to sampling errors and systematic non-response as we move up the distribution (Anand & Kumar, 2023). Therefore, any impression of rising or falling inequality based on surveys alone is misleading.
This type of bias is actually quite apparent in the 2022-23 consumption survey because the NSO has added an additional estimate of consumption which includes the value of transfers made by the government through various schemes 8The NSO calculates values for food (cereals, oils, sugar etc) and non-food transfers (laptops, school uniforms, bicycles etc) based on the items reported by each household. . These transfers are progressive, so that their intended target is the poor, not the rich. But the fact sheet shows that even the top 5% in urban India are apparently recipients of these transfers. The monetary value of transfers received by the urban top 5% is roughly a quarter of the amount received by the bottom 5%. It stretches credulity to believe that India’s urban rich, the very embodiment of the idea of India Shining, are recipients of pulses and bicycles from the government. 9A recent pre-wedding function for the scion of one of the top business families generated news with spending estimates ranging in the hundreds of millions of dollars. One wonders if these estimates include the imputed value of food and non-food transfers. The typical spending of the Top 5% urban Indians is estimated at around Rs 20,000 per month by the NSO. In some of India’s big metropolitan cities, monthly rent is higher than this amount. A simpler explanation is that the NSO is unable to stretch its machinery beyond the upper end of the middle class (who likely do avail of some welfare goods). Accordingly, the gap between the actual rich and the poor is not in the scope of this survey, which means we simply cannot use it to make any assessment of changes in inequality over the last decade. On the other hand, estimates of income and wealth inequality based on a combination of household consumption and wealth surveys, tax tabulations, national income and wealth accounts aggregates, as well as rich lists (e.g., Forbes, Hurun) show that the share of the top 1% in India is at a historical high (Bharti et al, 2024).
...[I]f we look at all the data generated on the Indian economy over the last decade in the absence of official data and compare them with these recent poverty estimates, it raises the question – how did poverty decline?
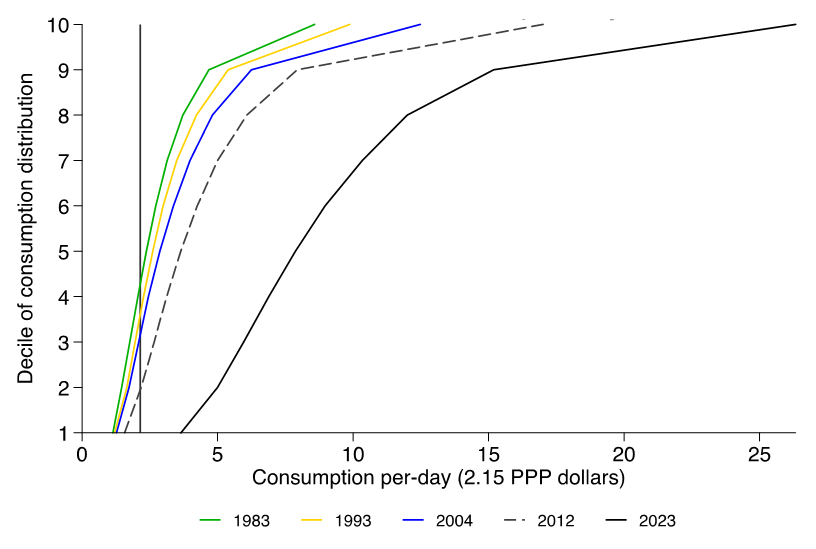
For Indians excluding the actual elite, the data presents tremendous gains in living standards. If we plot the average consumption expenditure of each of the ten deciles – the first decile is the poorest 10%, and 10th decile is the top 10% -- of rural and urban India for each survey since 1983, we can visualize the process of increasing consumption across the distribution. These movements indicate a universal increase in living standards with the relevant bits being the lowest few deciles. In 1983, only the top 3 deciles were above the poverty line but by 2023, we find the mean consumption of no rural or urban decile to be below 2.15 PPP per-day ( of course, there is variation around the mean and so this is still consistent with a certain fraction of bottom decile to still be below the poverty line). The ‘escape’ from poverty is driven by the sharpest rightward shift in the entire distribution during the 2012-2023 period (Figures 6 and 7).
Figure 6: Distribution of consumption in rural India 2022-23 (Each decile is represented by its mean consumption)
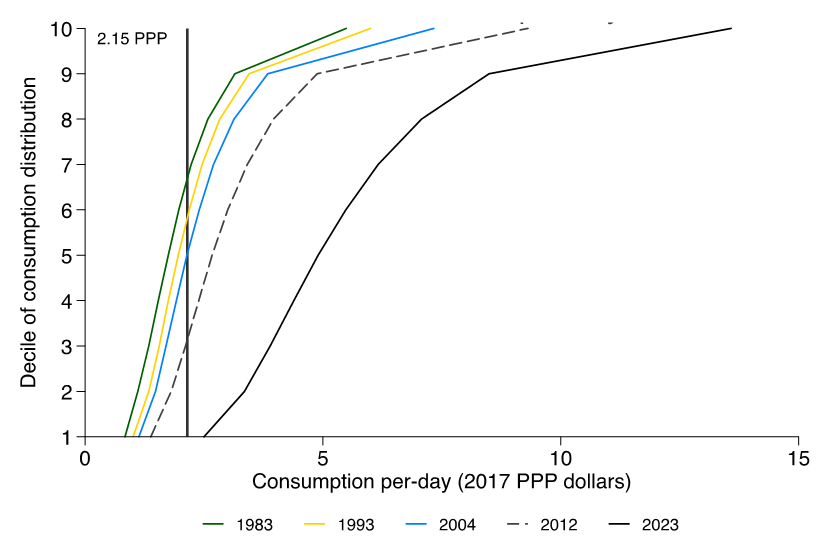
Figure 7: Distribution of consumption in urban India 2022-23 (Each decile is represented by its mean consumption)
Taken at face value, the fact sheet showcases the power of economic growth as a tide that lifts all boats by its inclusive nature. But if we look at all the data generated on the Indian economy over the last decade in the absence of official data and compare them with these recent poverty estimates, it raises the question – how did poverty decline? Certainly not through industrial development as the official GDP data itself shows. Was the decline a continuous process over the 2012-2023 period, or did it occur because of unexpected and more recent developments?
Based on all supplementary evidence in the intervening years, we explore an alternative explanation for the reported spectacular increase in the consumption of the poor. Neither the leaked NSO report from 2017-18 nor the exercises that have been carried out with PLFS data (Ghatak and Kumar, 2024, Himanshu et al, 2024), suggest a significant decline in poverty up at the beginning of the pandemic since 2011-12. 10We discuss our approach using the PLFS data below. What could have led to a sharp decrease in poverty after the pandemic? Here one has to be careful in interpreting the effects of the pandemic on poverty. On the one hand, it had poverty-increasing effects due to the contraction of output and rise in unemployment in 2020. But on the other hand, this period also sees a systematic shift in the level of spending on welfare programmes that clearly targeted the consumption of the poor. Therefore, we explore an alternative theory to one where poverty was driven down by trickle-down economic growth and consider an explanation that in the years following the pandemic there was a distribution-led improvement in the poverty headcount.
The government itself has been publishing other data which acts a proxy for the measurement of poverty in the pre-pandemic years. Starting in 2017-18, the NSO began publishing the Periodic Labour Force Survey on an annual basis to gauge the level of unemployment and the composition of the workforce. Importantly, these surveys also capture the distribution of daily wages on a nationally representative sample of households.
If we start with the simple assumption that the poor are also capital-poor, depending solely on their labour to earn a living, then these wages are a very good benchmark to measure per capita living standards. After all, save for transfers (in-cash and kind) from the state and central governments, the total daily wage of a household sets the upper limit for daily spending on all members of that household. We matched wages and consumption levels in 2011-12 across different states and sub-regions in India and used this relationship to calculate a hypothetical distribution of consumer expenditure for 2017-18 and 2018-19 (Ghatak and Kumar, 2024). For sake of comparability, we converted the nominal amounts using the corresponding PPP levels for those years, and dividing consumption equally within the household, we estimated that approximately 18-20% of the population would have been below the 2.15 PPP per-day poverty line in the 2017-19 period. Note also that independent estimates from the Labour Bureau show that wages of rural male workers in agriculture, non-agriculture and construction have been very slow to increase (Balakrishnan & Parameswaran, 2024) over the entire span of 2014-2023, lagging per capita incomes by a significant margin.
In short, the government was forced by an unprecedent situation (albeit, not of its own making) to become an “accidental welfarist.”
In addition, the PLFS surveys also have a line item to measure (besides wages) the consumption spending of each household. These estimates are not as detailed, or in-depth, as the actual consumption surveys because households tend to underestimate their spending without a tabulation of items representing the consumption basket. This makes a direct comparison with the CES data from 2011-12 problematic. However, even if we assume an underestimation of consumption, there is no reason for this underestimation to vary over time. This is to say we can at least gauge the pace of poverty decline and evaluate any special breaks in trends. Based on these numbers, we calculated consumption per-person for 2017-2019, finding poverty headcounts of 22-25% at the 2.15 PPP line. Remarkably, these very same consumption estimates show the poverty headcount dropping in 2022-23 to 8%, in line with both the 2022-23 CES fact sheet and the argument that the fall in poverty was most likely a post-2020 phenomenon. This gives us confidence in this indirect approach that we take to understand the trends in poverty between the two rounds of the official statistics from the CES in 2011-12 and 2022-23.
At first pass, it seems strange to argue that a pandemic that will be remembered for its brutal impact on the livelihoods of the poor instead caused improvements in their living standards. But the pandemic was also instrumental in forcing the state machinery into action and open its coffers to emergency welfare measures. For instance, the best-known example is the prime minister’s food support plan (PMGKAY), which built on the pre-existing National Food Security Act to provide rice and pulses to 800 million people at zero cost. The increase in the Government of India’s food subsidy bill between 2019-20 and 2020-21 was nearly fivefold and the net amount of the subsidy remained structurally higher every year since 2020. In simplest terms, provision of food relaxes the budget of recipients to spend elsewhere no matter the level of income. As a first approximation, there is a simple mechanism at play – public spending on welfare rises, consumption of the poor does too.
Based on our preliminary calculations, it is unclear if the imputed values computed by the NSO are fully accounting for the total value of welfare. We estimated the increase in annual consumption due to welfare to be Rs 1044 and Rs 744 for the rural and urban sectors, respectively, which add up to Rs 76,747 crore in 2022-23 for 813 million individuals 11To aggregate the total amount, we assumed a 2/3 to 1/3 weight for the rural and urban sectors respectively. versus the allocated Rs 2,87,194 crore in food subsidies alone. One potential explanation is that the NSO is not completely identifying the true weight of welfare in the consumption basket. In the absence of more detailed data, we refrain from further speculation.
In short, the government was forced by an unprecedent situation (albeit, not of its own making) to become an “accidental welfarist.” To the extent the data between these two rounds of CESs separated by a decade are comparable (which a closer scrutiny when the full data are released can ascertain) and we take this large drop in extreme poverty at face value, these actions can provide an explanation as they had sufficient brute-force monetary weight.
There is a second, equally, important takeaway that this sequence of events suggests: making a serious dent to extreme poverty is a policy choice rather than simply an expectation out of economic growth. 12The same can be said of MGNREGA which can be seen in the accelerated decline in poverty between the 2004-05 and 2011-12 surveys. The corollary is therefore that this choice was available in previous years as well but was not deemed necessary. As we stress, there is little to suggest that the economic growth over 2012-2020 made a difference to living standards at the bottom of the distribution. Based on this logic, one can also explain India’s exceptionalism in the headcount poverty-agricultural share relationship shown for Asian countries in Figure 5. In fact, the ability of these pandemic-era responses to move the “unmovable” is not unique to India. The economic security programmes initiated in 2020 and 2021 in the US brought its poverty headcount to a five-decade low in 2021 (Trisi, 2023). A corollary to this argument though is, making further dents to poverty would be harder and harder without sustained economic growth for its direct effects on wages and employment opportunities, but also by increasing tax revenue that can fund social safety net programmes.
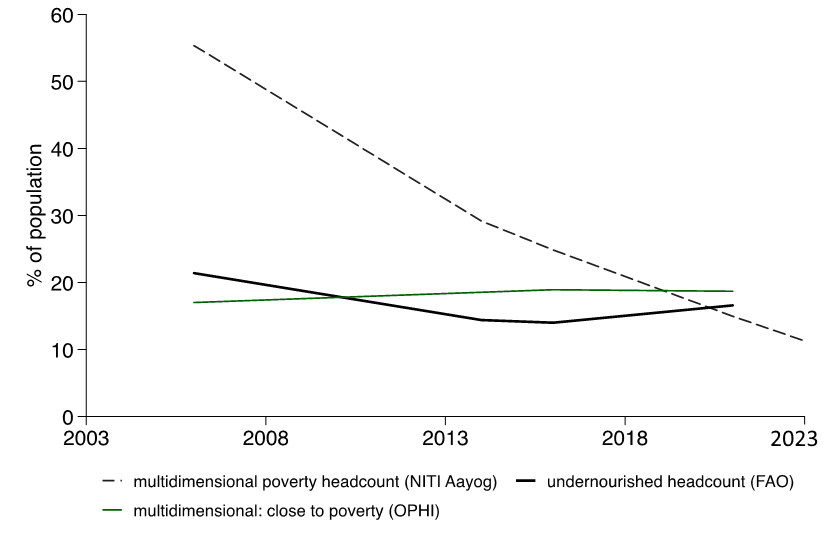
Figure 8: Multidimensional Poverty and Undernourishment in India
One could ask whether any of the discontinuity matters because whatever the tool, in the grand scheme of things, it did the job. But in fact, there is ample reason to posit that it does matter. Elimination is a terminal description and while there may well be permanent achievements from these policy actions, ultimately the intentions of the government suggest it realizes the difference between permanent and temporary drops in poverty. For example, the flagship project of the incumbent government – Make in India – is essentially a directed step towards manufacturing-led growth in line with historical experience elsewhere. And, despite its lack of impact (so far) on the manufacturing share of output and employment, the commitment to this policy has remained steadfast. Until this policy gives returns by raising employment and incomes for the vast majority (eventually raising livelihoods of the bottom 20%), persisting with robust social safety nets is the only recourse towards poverty reduction. Unsurprisingly, the government has itself recommitted itself to the food grain transfer scheme for two-thirds of the population, despite lifting all restrictions related to the pandemic and despite its own recently released data suggesting that extreme poverty has declined sharply.
Finally, to continue publishing report cards in the absence of consumption data, the government’s think tank (NITI Aayog) has shown its preference for a different poverty indicator: the multidimensional poverty index (MPI). This indicator measures deprivation besides the standard dimension of monetary poverty by rewarding service delivery in health, education and infrastructure (electricity, piped water etc). With no up-to-date information on monetary means, it is effectively an index of service delivery. The NITI Aayog’s own calculation of multidimensional poverty for 2022-23 estimates 11% of the population to be still in poverty; based on present population estimates this implies around 145 million people. We are thus left with the peculiar takeaway that a government, praised for its use of service delivery in the fight against structural poverty, scores less on multidimensional poverty than it does on monetary poverty. The fine print is revealing -- while hundreds of millions have escaped multidimensional poverty in the last decade and a half, the fraction of Indians that are at risk of slipping back (“close to poverty” in Figure 8) have barely budged from 17% over the last two decades. The headcount for undernourishment (measured by the FAO) also remains stable through much of the 21st century despite the household budget swelling most favourably in the last decade as evidenced by the 2022-23 CES.
Unsurprisingly, the government has itself recommitted itself to the food grain transfer scheme for two-thirds of the population, despite lifting all restrictions related to the pandemic and despite its own recently released data suggesting that extreme poverty has declined sharply.
Finally, we turn to another potential factor that may have played a role in the universal increase in consumer expenditure over the last decade. Based solely on the summary statistics in the survey, we know consumer expenditure patterns have changed with respect to the weights of food versus non-food items (especially, a sharp increase in the share of expenditure on conveyance in both rural and urban areas). To the extent prices of different items did not change at the same rate over the last decade, by not adjusting the weights and applying the average inflation rate to the 2011-12 poverty line, we would not be correctly estimating the poverty line for 2022-23. Several experts have argued that the evolution of prices remains unresolved (Subramanian & Felman, 2023) and deflators used are based on the Consumer Price Index (CPI) extrapolated from the 2011-12 consumption survey (Sapre & Bharadwaj, 2023).
There are two issues here. First, the CPI is based on the consumption basket of the average person, while what is relevant for a poverty line is the consumption basket of, say, the bottom decile or quartile where the poor come from. The difference can be non-trivial given the well-known stylized fact (known as Engel’s law) that expenditure patterns between different income groups vary significantly. Moreover, if the prices of items which have a greater share in consumer baskets of the poor now rose at a faster rate than the general inflation rate, and to the extent their greater expenditure shares partly reflects increases in prices, we would be overestimating the drop in poverty. 13Conversely, to the extent the items that had a greater weight in consumer expenditure the 2011-12 survey than the present one, experienced greater price increases, we would be underestimating the extent of poverty decline using the old poverty lines with (average) inflation adjustment.
Therefore, applying the CPI to accurately capture the cost of living of the poor is not without problems. Because of data limitations, we cannot rigorously examine to what extent this factor may have played a role in the apparent drop in extreme poverty over the last decade. With the information provided by the new survey, the authorities will need to furnish a new national poverty line, which measures the India-specific minimum monetary amount necessary to escape poverty. 14The international poverty line is estimated using the national poverty lines of the poorest countries. In 2011-12, the line was set at 1.90 PPP and the monetary translation was close to India’s own poverty lines proposed by the Tendulkar Committee. Note that over the last 15 years, India has transitioned from a lower-income to lower-middle income country as per the World Bank’s classifications. Note that the International Comparison Program (ICP) will likely update PPP measures once cost baskets are incorporated into their calculations. India’s PPP exchange rates may also adjust accordingly. If these adjustments are significant, then there is a possibility that the present level of spending may not be sufficient to lift the poorest 10-15% out of poverty.
4. Conclusions
While our conclusions are more circumspect than what seems to be implied by what the fact sheet released by the NSO seems to be suggest, the official authorities also bear responsibility for precipitating the controversy regarding the assessment of Indian poverty. Unprecedented actions such as withholding data, releasing summaries before elections with no reference to the 2017-18 survey that was never published, or even resorting to service delivery metrics (such as multidimensional indices) do not generate confidence.
It will take more time and a full disclosure of the unit-level data before all the implications of the 2022-23 round of survey results are clear. Overall, a fully convincing announcement of the very welcome news of the virtual elimination of extreme poverty in India may lie further into the future.
Acknowledgements: We thank, without implicating, S. Subramanian and C. Rammanohar Reddy for helpful comments on an earlier draft, and Zaeen DeSouza and Linchuan Xu for research assistance.
This is the second in this symposium on poverty in India. The first article by S. Subramanian was published on April 5. The third is scheduled to be published on April 19.