


Earth’s climate, as we know it, is changing rapidly. We have had many records broken this year and have become accustomed to such occurrences. It is no news that commensurate with these broken records is the number of extreme events we see around us. Given the gravity of the problem and the scale of damage to humans, wildlife and the environment, what are the barriers to predicting the future climate on Earth? What's the secret recipe that scientists use to make such predictions and how reliable are their predictions?
We will explore these questions in this article but before that, it is important to appreciate the complexity of Earth’s climate.
Earth’s radiative balance
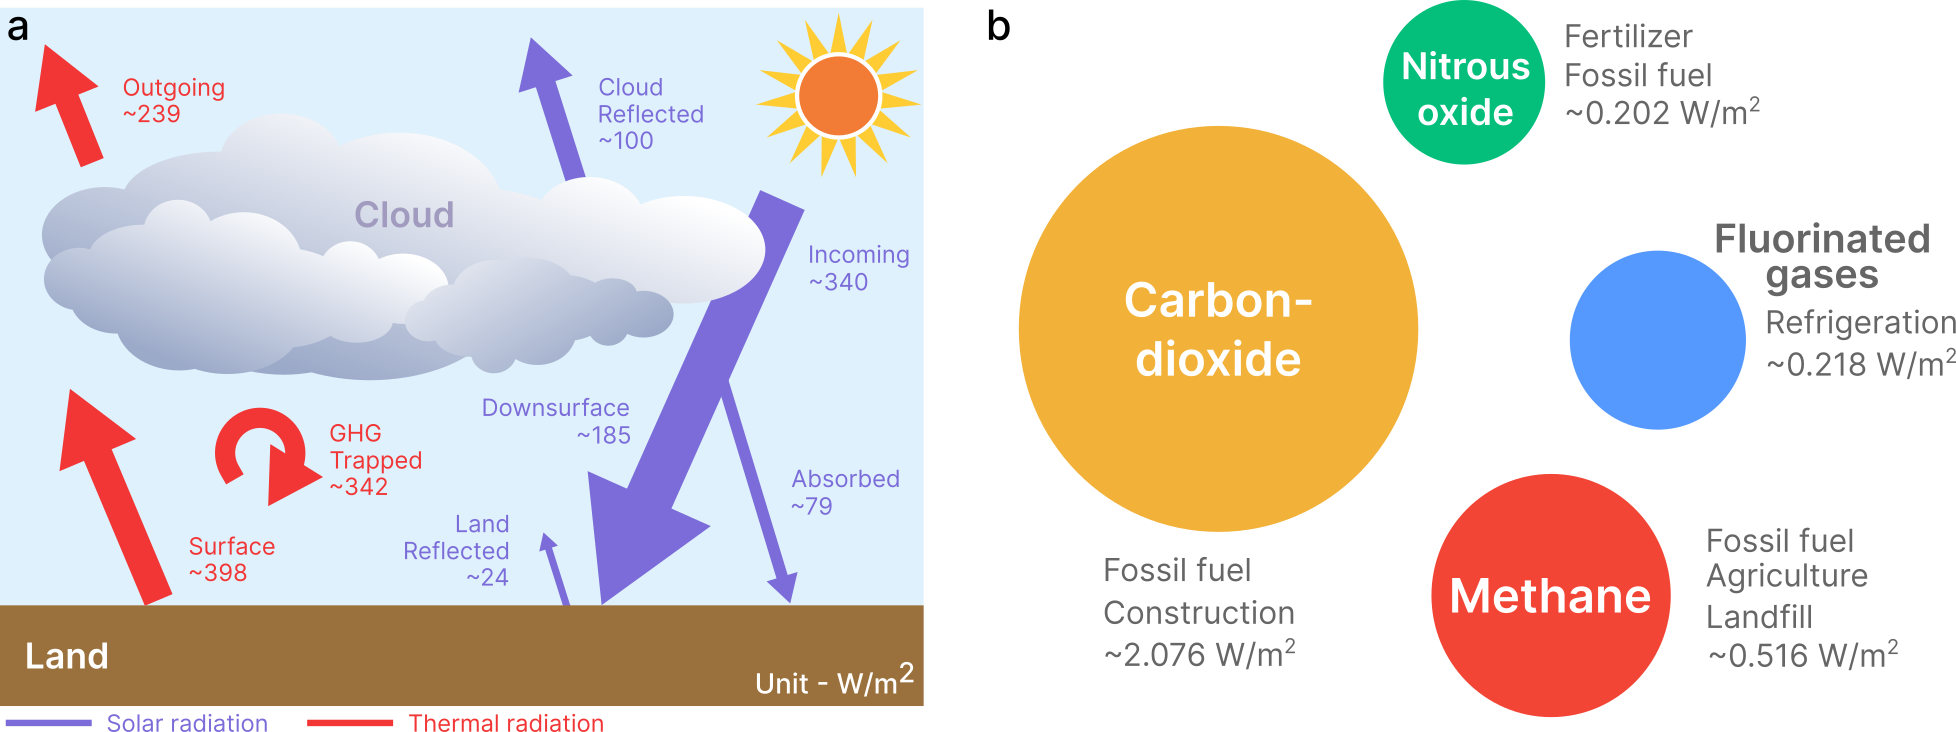
Our climate is driven by various processes, known as the physical drivers, with the Sun being the primary source of energy (with a minor contribution from geothermal heat from the interior of Earth). Sun’s energy, in the form of short wavelength electromagnetic waves/radiation, enters Earth’s atmosphere and is then either reflected into space or absorbed/trapped. The reflectivity of Earth’s surface, called the albedo (we will come back to this important component later), depends on the cloud, snow or ice cover across different regions of our planet. Approximately 30% of the Sun's energy is reflected outward due to albedo and Earth also radiates heat outwards from the land surface and atmosphere. This calculus between different energy components (also called the radiative flux) is referred to as the radiative balance and is pivotal to capture Earth’s equilibrium temperature. Human activities, primarily in the form of Green House Gas (GHG) emissions are affecting this radiative balance, increasing the trapping of heat and in effect increasing the temperature of Earth. Scientists use the quantity Radiative Forcing (RF), in units of Watts per meter2 (W/m2), defined by the change in the radiative flux due to changes in a particular driver/process, as the measure of radiative imbalance across the surface of Earth. A positive RF implies a warming effect due to a particular driver and a negative RF implies a cooling effect. Over the industrial era (usually defined as years 1750-2011), human-caused imbalance in radiative fluxes, dominantly due to GHG emissions, is approximately 2.3 W/m2 while the imbalance due to solar radiation (arising out of changes in irradiance of sun and sunspots) is 0.05 W/m2.
Green House Gases
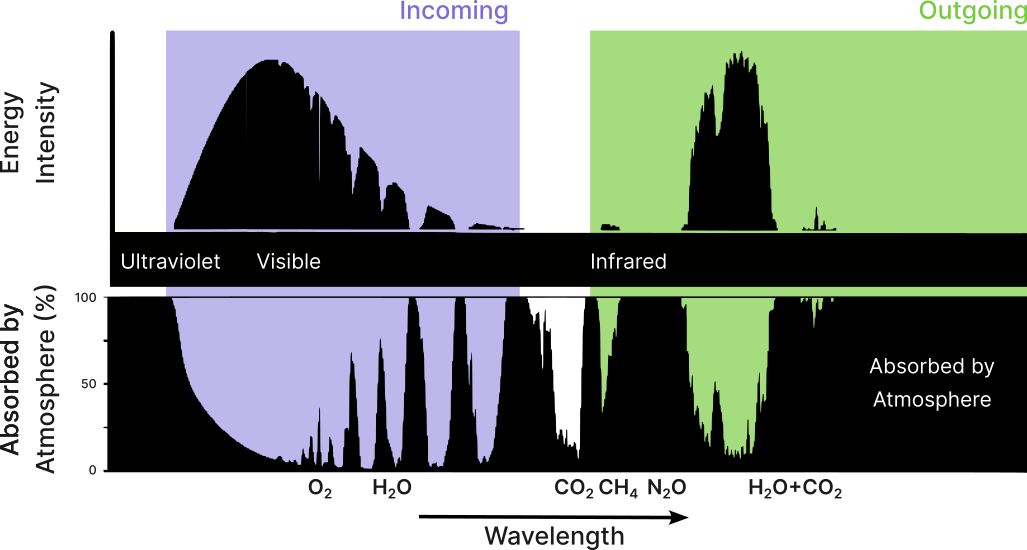
Now that we have a measure of the imbalance caused by a particular process i.e. the RF, let us briefly describe how GHGs work. GHGs are molecules of gas with a particular property of absorbing long and short wavelength radiation and emitting long wavelength energy (long wavelength energy is synonymous with heat). The energy they absorb can either be from the Sun or emitted by Earth or other GHGs. And since the energy that GHGs emit is in the form of heat, other GHGs again absorb this energy. This trapping of the long wavelength energy by the GHGs is the well-known Greenhouse effect. The greenhouse effect, contrary to what one would believe, is also fundamental to life. Without this effect, the earth would have been stuck as a frozen ball forever.
Relevance of climate models
Why do we need to know all of this to understand the role of climate models? And why are these models relevant at all? Well, the short answer is that to be able to predict the future of Earth’s climate we need to accurately capture the processes we have described so far (and much more, as we shall see). Further, the role of climate models today cannot be understated, they have become central to our conversations about climate change. The combination of climate model predictions with Integrated Assessment Models (IAMs), which account for different socioeconomic effects of climate change, now drives policy across the globe. Different future trajectories of our planet, technically referred to as Representative Concentration Pathways (RCPs), are arrived at by considering various feasible scenarios of GHG emissions.
Four RCPs have been derived by fixing a target radiative forcing of 2.6, 4.5, 6, and 8.5 W/m2 by the year 2100 and back-calculating the emission scenarios that would result in each particular value of RF. The reliance on models for such paramount decisions reflects the confidence in this edifice and has come after a century of scientific understanding of our climate. This seemingly immaculate enterprise still has some important questions unanswered and has in the past been the cause of false scepticism about climate change.
Climate models
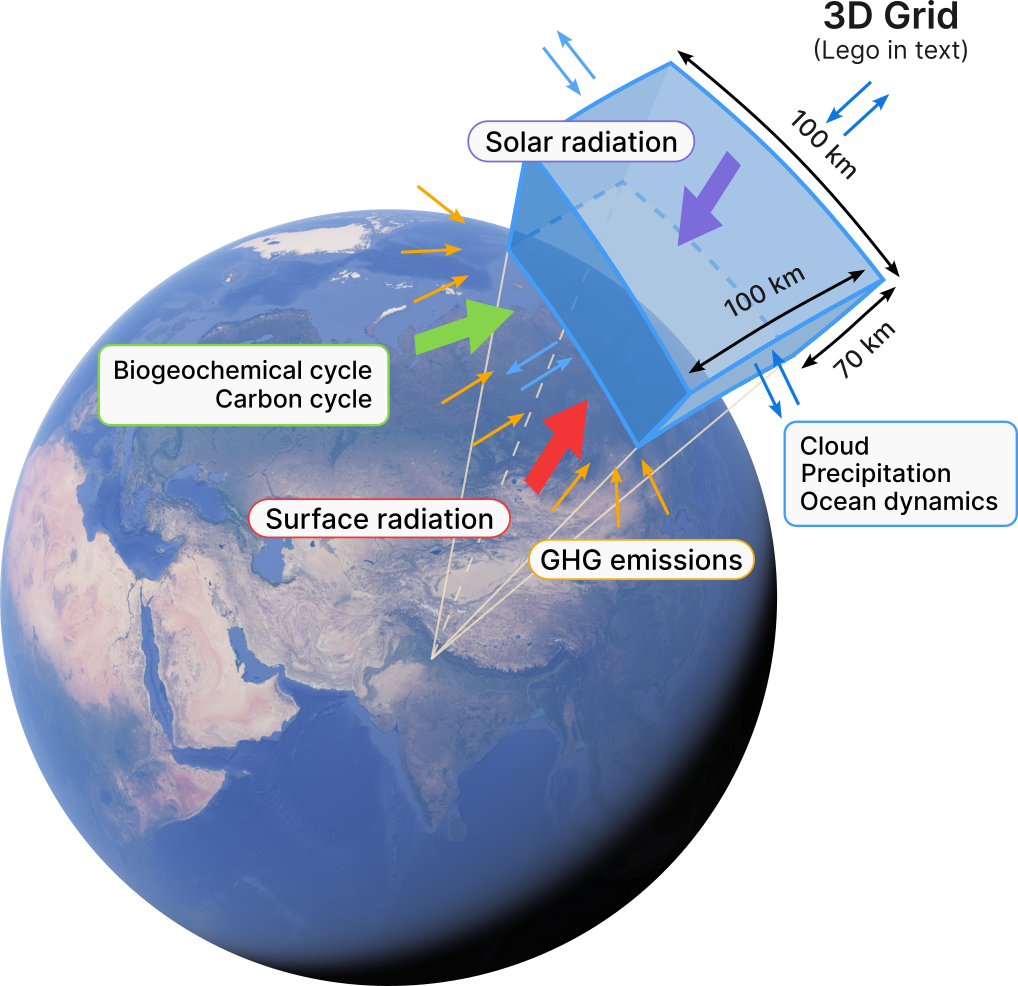
To understand the climate of Earth’s past without direct measurement, scientists have developed a whole array of tools. These indirect measurement techniques rely on fossil records and spectrograms of gasses trapped in ice cores to arrive at a picture of Earth’s paleoclimate. Similarly, we have developed an assortment of simulation tools to emulate the diverse processes in our atmosphere, ocean and landmass on a computer. These computer models, termed Global Climate Models (GCMs), help determine Earth’s future by capturing the evolution of important quantities such as the concentration of GHGs, surface temperature, wind patterns, snow cover and precipitation/rainfall patterns across the globe. The underlying basis of these models is mathematical equations that capture the coupled dynamics of the physical and chemical processes such as radiative fluxes, ocean and atmospheric fluid flow, vegetation on land, biogeochemical and carbon cycles. Since the GCMs attempt to simulate the whole Earth, they account for the widespread variability in these processes across different continents, a lot of which comes from experimental measurements. All these different layers of complexity make a GCM a delicate task demanding special expertise and a collective effort.
Discretisation and initial condition
GCMs simulate Earth’s climate starting at a particular point in time with satellite and meteorological measurements and propagate the state of the atmosphere forward. To propagate in time the variables of interest, the volume of Earth’s atmosphere, landmass and ocean are discretized. This intuitively means that the volume of Earth is considered to be made of an assembly of several Lego blocks. The coordinate of a particular latitude, longitude and height above/below sea level is a Lego block and is assigned a value of temperature, velocity, pressure, concentration of GHGs and precipitation at a particular instant of time. These values are updated from the previous time to the next instant based on the mathematical model capturing the interaction (in the form of various exchanges in energies) between two neighbouring Lego pieces. State-of-the-art simulations (such as in the IPCC Assessment Report 6) consider the size of these Lego blocks (also called the spatial resolution) to be 100 x 100 x 70 km3 and the temporal resolution to be approximately an hour. This gives us approximately 1 million Lego blocks to keep track of at each instant for approximately 2 million time-steps to simulate a century. Such large models run on some of the most powerful supercomputers in the world for several days and are thus extremely expensive. An important aspect of GCMs is that with such a prescribed resolution in space and time, they can only capture features in different climate variables (such as temperature, precipitation etc.) that are larger than the smallest Lego size and take place slower than an hour. Moreover, the problem is made adverse by the fact that large-scale processes are strongly affected by small-scale processes smaller than the size of a lego. There are several GCMs developed by climate scientists based on the feature they are interested in capturing accurately and these are by no measure complete or exhaustive. Their complexity has consistently increased over the last century as we understand more about our climate.
Subgrid processes, parameterisation and tuning
A natural question that might arise from how GCMs work would be: “What happens to processes that happen at scales smaller than 200 km and faster than an hour? How are they accounted for in the model if they are crucial to determine the large-scale features?”. This forms one of the central questions in modern climate science and such features that are smaller than the size of the Lego block are called subgrid processes. Some of the subgrid processes include the dynamics of clouds (which are made primarily of micron-sized water droplets), aerosol particles in the atmosphere, and exchange of energy between ocean and atmosphere. The effects of these processes are captured in GCMs via parameters estimated from satellite data, however with large errors. Parameters in GCMs that are difficult to measure from experiments are tuned to fit some of the observations and can often have large variabilities. Subgrid processes have in the past resulted in a lot of scepticism about the capabilities of GCMs (really the erstwhile General Circulation Models) as these parameters could not be independently measured in laboratory experiments. A lot of these scepticisms have been put to rest by rigorous tests (described in detail in the IPCC AR4).
Consistency checks, predictions and weak links
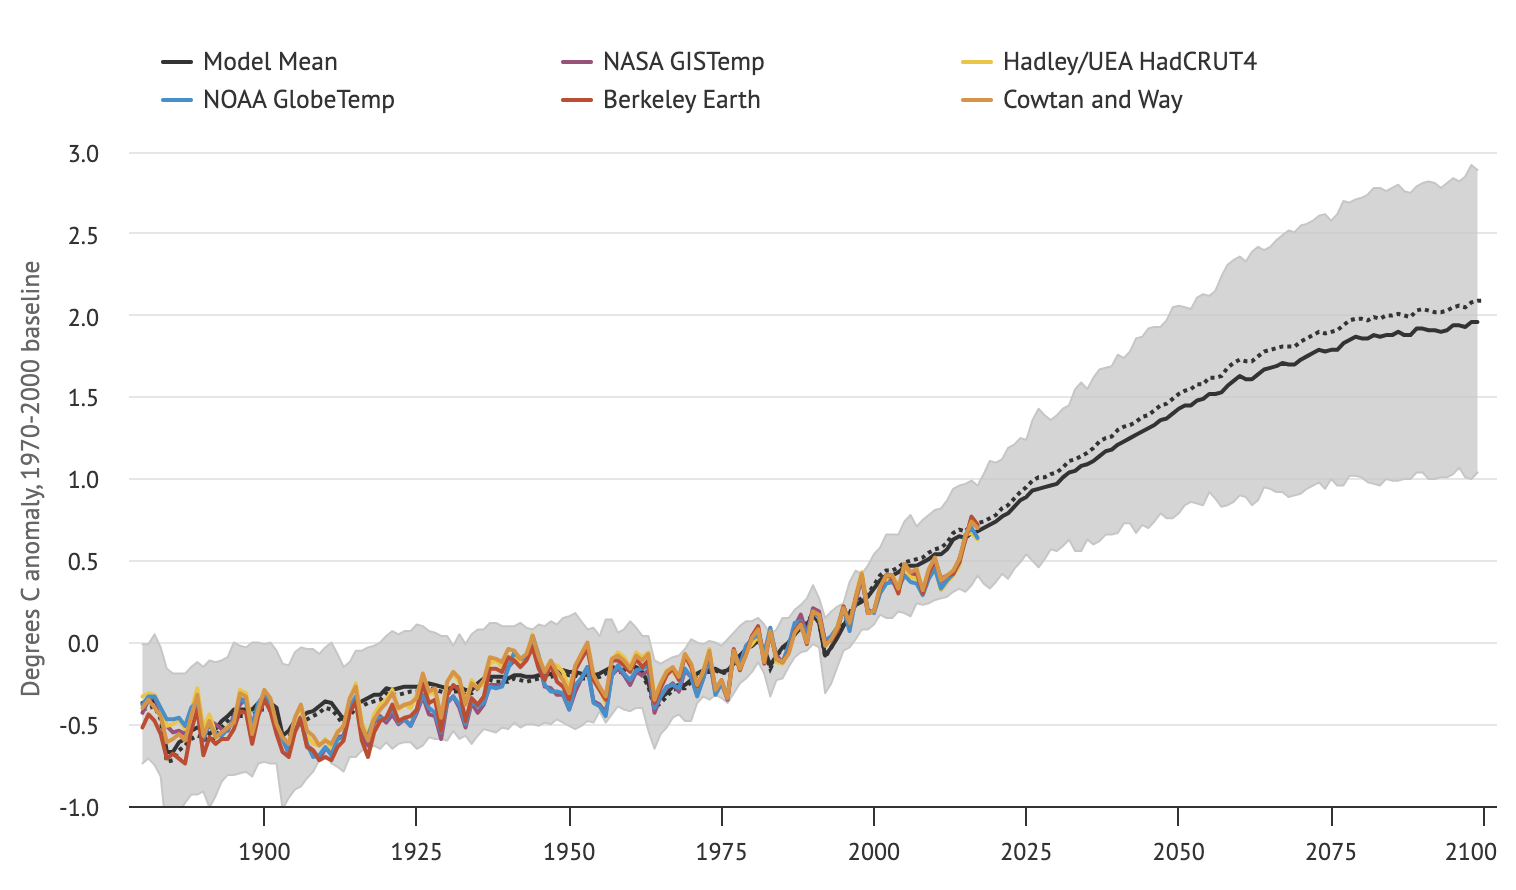
Scientists have tested GCMs for a variety of scenarios to understand their capabilities and limitations in order to make them robust. Given that several research groups around the world use GCMs with different parameters, a central organization – the Coupled Model Intercomparison Project (CMIP) – has been established, whose primary role is to ensure all GCMs follow a benchmarked set of assumptions. The IPCC uses the results compiled by the CMIP, with the model parameters based on emission scenarios given by the IPCC, to perform their assessments. As it stands, the GCMs have high confidence in predicting long time-scale features (of approximately decades and longer duration) in different variables such as temperature, precipitation, radiation, and wind accurately, while their capabilities for short durations (of days) are being consistently improved. Some of the successes of the models include capturing the advancing and retreating of major monsoon systems, seasonal shifts in temperature, and large-scale pressure fluctuations across the northern and southern hemispheres. Given our direct measurements of surface temperatures from the late 1800s, the model predictions match them as well (as shown in Figure 4).
In the recent IPCC report (IPCC AR6), considerable progress has also been made to uncover the issues related to cloud cover (along with ice) and aerosol particles in the atmosphere which are one of the dominant contributors to the albedo effect. This had long remained one of the major sources of errors in a variety of climate models. The difficulty in estimating accurately the effects of clouds stemmed from their dynamic nature and their coupling to subgrid physics. Moreover, clouds strongly affect the flow of both sunlight and infrared/long wavelength radiation, which makes estimation of their effects crucial. It is now found through models that clouds in the tropics trap infrared radiation, increasing the warming effect and the mid-latitude clouds reflect less sunlight to space also resulting in a warming effect.
The confidence in capturing the effects of small-scale (tens of kms), and shorter time-scale processes (of a few hours to days) is still low. One of the approaches taken by scientists is to decrease the size of the Lego blocks in simulations for which the capacity of the computers is the barrier. Another approach to bridge this gap and to address the source of uncertainty is for scientists to use regional models and earth system models of intermediate complexity. The focus there is on accurately capturing the dynamics of climate in different parts of the world, instead of on Earth as a whole or to come up with simpler models that are parameterised better but still capture the fine features. The models also do not capture some of the well-known weather patterns (such as the Intertropical Convergence Zone and the Madden-Julian Oscillation), that are relevant for rainfalls in the tropics.
Future of GCMs
The alarming rate at which our planet is becoming uninhabitable is only making scientists work harder to address the limitations of GCMs. The coming decades will see progress towards accurately capturing the effects of subgrid processes and our reliance on climate models will only increase. With modern machine learning tools, climate models are also undergoing rapid change with expertise from various disciplines pouring in. Beyond this, there is a growing recognition that the models are not just mathematical toys for academic endeavours but are maps for a habitable green future.
Ganga Prasath is a member of the faculty of IIT Madras. He is part of Project Climate, a nascent platform intended towards climate change related awareness via the student group Vivarta.
Acknowledgements: The author thanks Prof. Amala Mahadevan, WHOI-MIT and Prof. Rama Govindarajan, ICTS-TIFR Bengaluru for their comments and critical reading of the article. He also thanks Dr. Swati Umasanker for inputs.