

About 50 years ago, during the 1970s, rapid population growth was a burning issue in India. The annual growth rate was more than 2%, the country had gone through some droughts, foodgrains had to be imported, and feeding the rapidly growing population was a daunting task. There was talk of a population explosion and demands were made for taking “strong” measures to control population growth, specifically for lowering fertility.
The National Population Policy of 1976 called for a direct assault upon this problem as a national commitment. Some harsh measures were tried out, though soon abandoned as there was a public outcry against these. However, before the end of the century, there were signs that fertility had begun to decline in India and some parts, notably Kerala, Tamil Nadu, and Goa, had reached replacement level fertility, with the total fertility rate (TFR, the average number of children a woman surviving to the end of the reproductive period would bear in her lifetime) falling to 2.1. The decline in fertility was seen, to various degrees, in all parts of the country and in all sections of the population.
Socio-economic development and a rise in aspirations about children have led to a preference for small families, and fertility regulation is widely practised by Indian couples, which has been facilitated by contraceptive services made easily available through government programmes. There is now unequivocal evidence that fertility decline has continued and fertility in India has fallen to a low replacement level with the total fertility rate reaching 2.0. As a further decline in fertility to levels below replacement seems imminent, population growth is no longer expected to be rapid.
While the size of India’s population is not going to rise substantially, the age structure is bound to change notably, an inevitable consequence of the transition from high fertility and mortality to low fertility and mortality.
The population will certainly grow for some more time, on account of “population momentum”, but at a slower pace, reach a peak, and then decline gradually, unless there is a notable rise in fertility, which seems unlikely. The United Nations Population Division (in its Medium Variant) has projected India’s population to peak at a level close to 1.7 billion in the 2060s and then decline to 1.5 billion by the end of the 21st century (UN 2022). Thus, India’s population will increase by just about 20% percent from the present estimate of 1.4 billion. Debates on population control measures are no longer relevant. The spectre of a population bomb no longer exists.
While the size of India’s population is not going to rise substantially, the age structure is bound to change notably, an inevitable consequence of the transition from high fertility and mortality to low fertility and mortality. As fertility declines, the number of births falls and the share of young people in the population declines, while that of older people rises. Essentially, the population ages.
This can clearly be seen in the age distributions from UN projections (Table 1). The share of working age people in the population will rise for some time, lowering the dependency ratio and yielding a demographic dividend, which has been widely discussed by policymakers and the media for some time. Two aspects of this dividend are well recognised. First, it is available over a period, called the “window of demographic opportunity” and will end after that. In India, the share of the working age population (generally, those aged 15 to 64 years are considered of working age, though one might argue that 20 to 59 years or 20 to 64 years could be better ranges) has risen from 60% in 2001 to a projected 67% in recent years, and is projected to rise to 69% in the 2030s before beginning to fall in the 2040s (Table 1).
The dependency ratio, that is, the number of dependents of a young age (below 15 years) and of old age (65 years or older) per 100 people in the working age group has fallen from 66% in 2001 to below 50% now. It is projected to go further down to 45% in the 2030s. One may consider a population to be in the “dividend phase” if the share of the working age (ages 15-64) population is 67% or higher (that is, the dependency ratio is below 50%). Accordingly, India is already in the dividend phase but the advantage of a favourable age distribution will wane after the late 2030s and the country will be out of this phase soon after 2050.
The second aspect of the dividend, also widely recognised, is that this is actually a “potential dividend” and must be harvested by creating employment for those in the working age group, enhancing the quality of the labour force, and ensuring greater female employment.
Table 1: Recent and Projected Trends in India’s Population Size and Age Distribution
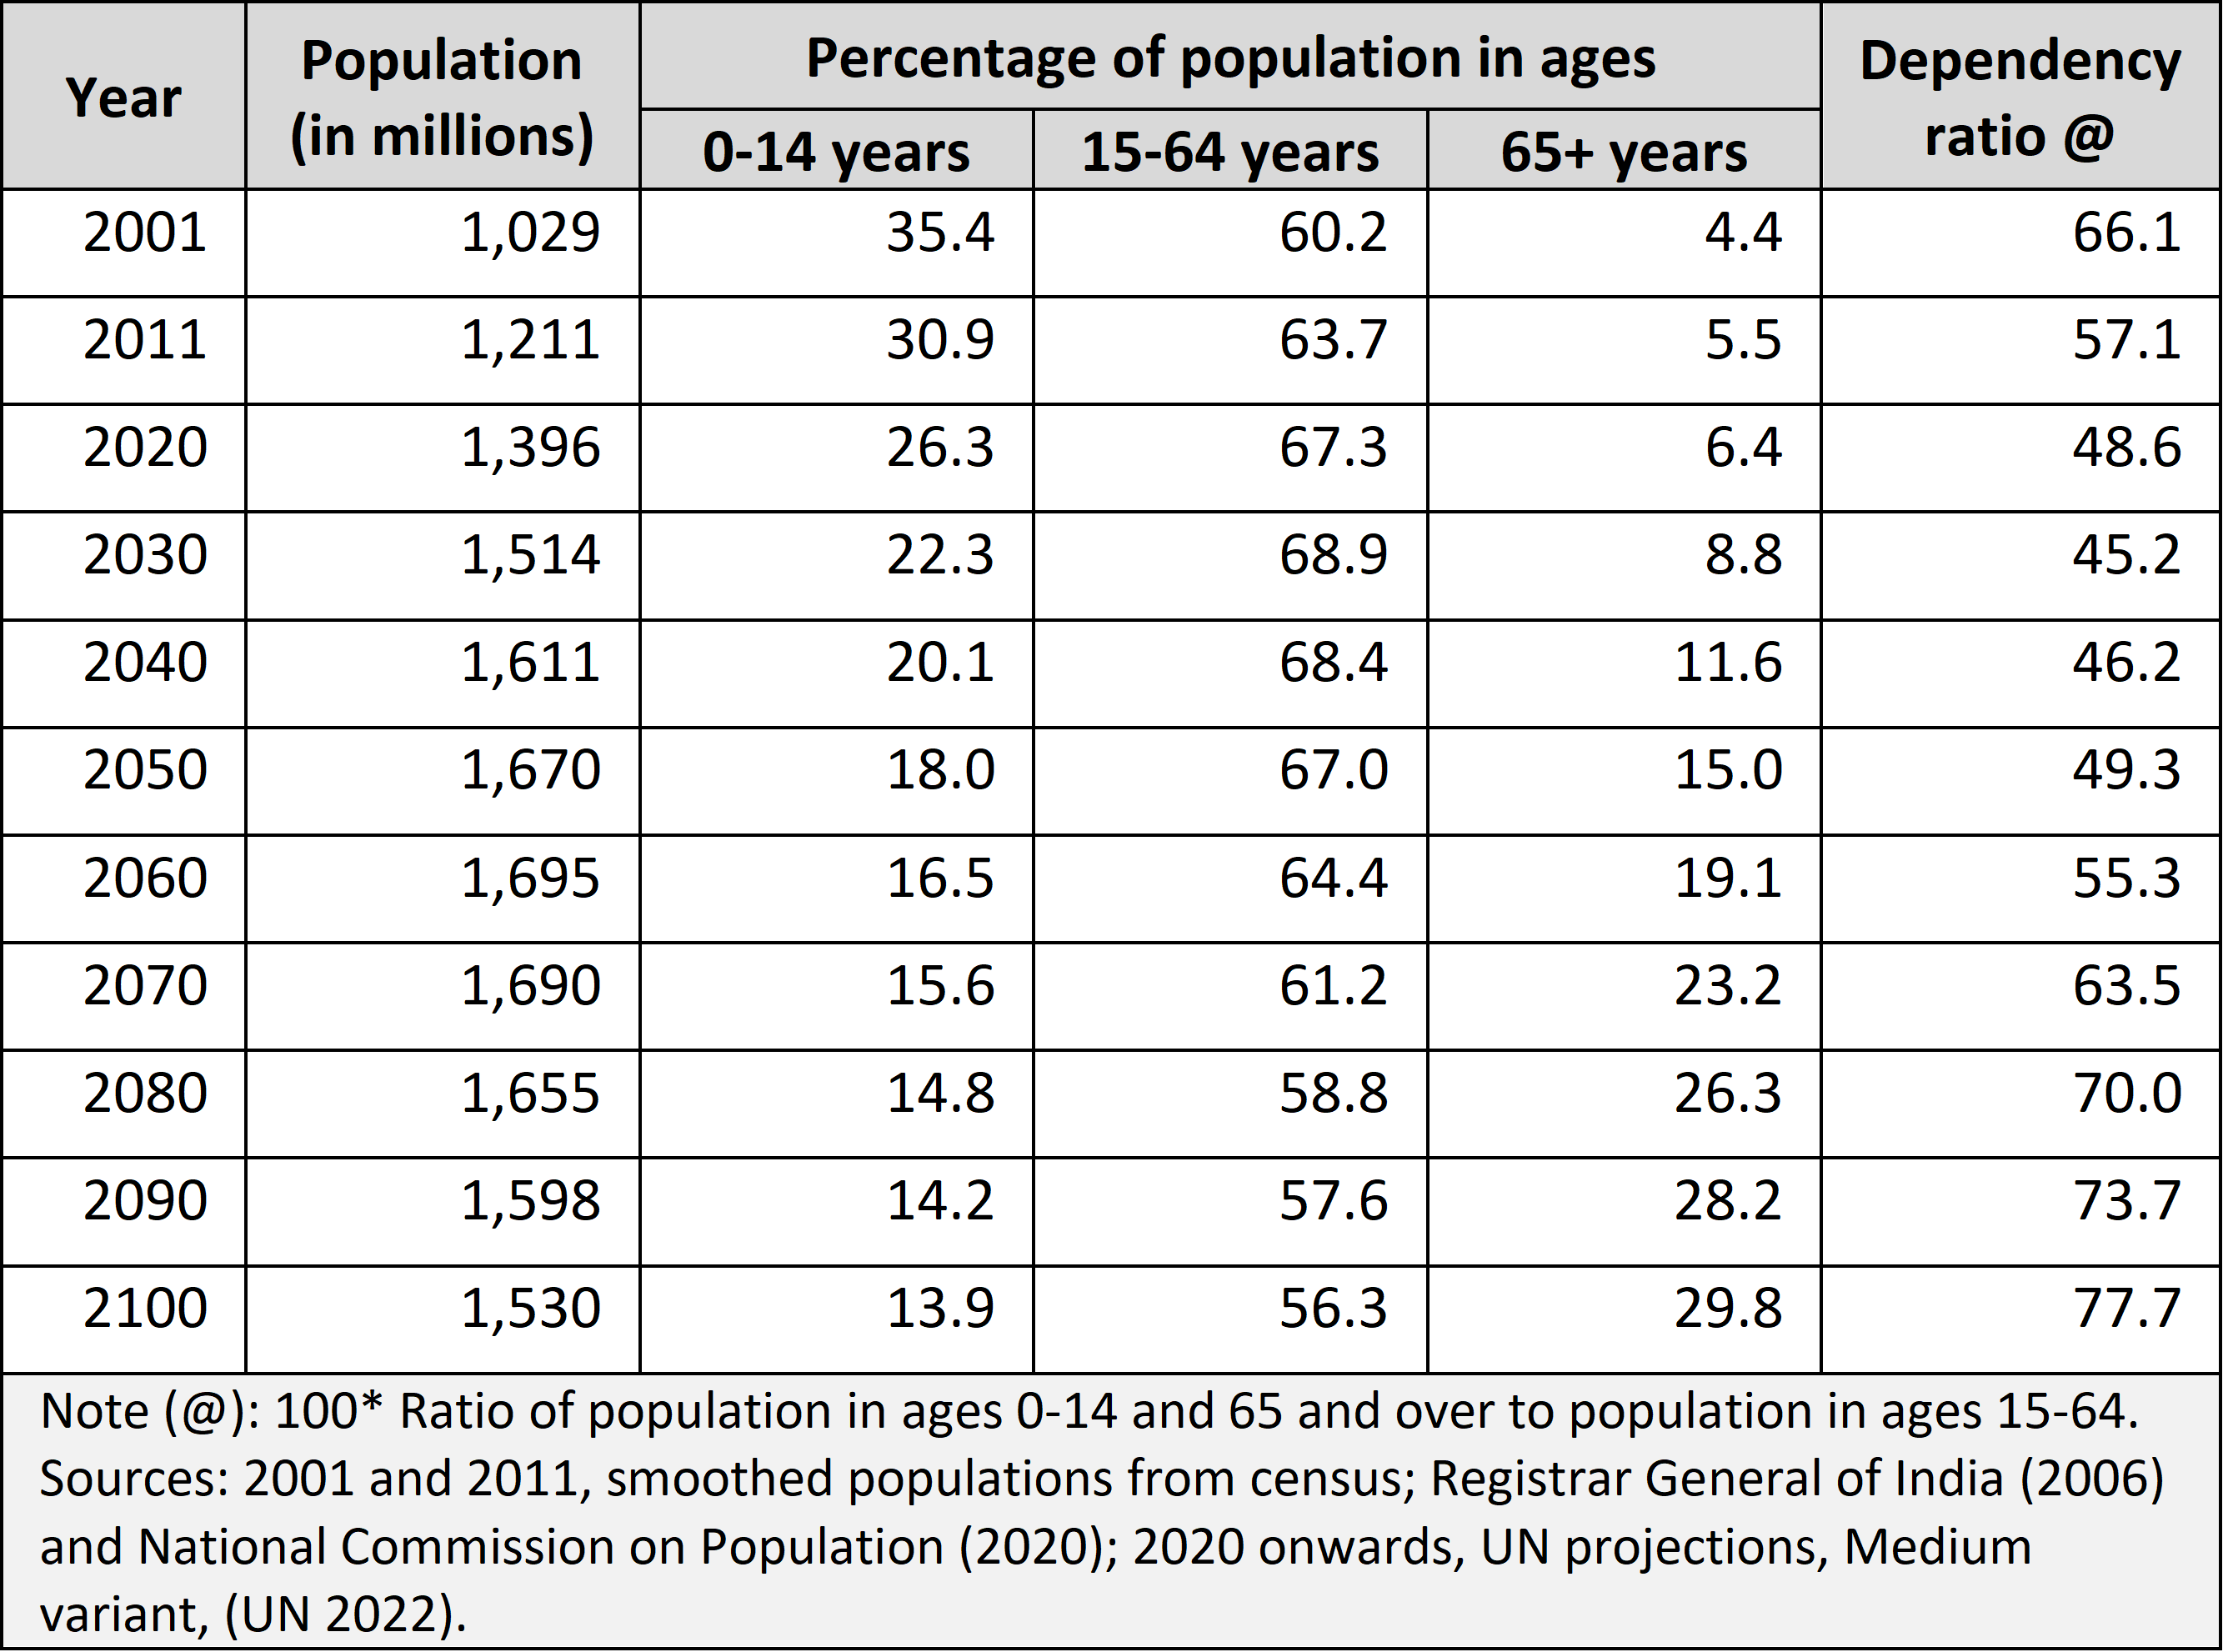
The share of the elderly will also rise over time. In contrast to the share of the working age population, which is projected to first rise and then fall, the proportion of the elderly will rise monotonically for a long time. The increase in the share of elderly over the century will be phenomenal, from a shade below 5% at the beginning of it to nearly 30% towards the end. Clearly, the population will have to care for a much larger population of the elderly than in the past.
Traditionally, the elderly and one or more of their adult children lived together as a family. However, as the family size has shrunk, family arrangements for the support of the elderly have become difficult. This calls for developing an institutional mechanism for elderly care. This would involve financial support in the form of pensions as well as physical support and healthcare. Moreover, the health service systems must take the needs of the elderly into account and provide the appropriate services for chronic diseases, geriatric health issues, and palliative care. Fortunately, as the increase in the share and number of the elderly is gradual, there is time to develop and refine an elderly care mechanism.
All the states are expected to reach a peak population size and then begin a decline, and also undergo changes in age structure. However, the timing of such changes will depend on when the process of transition begins.
The picture presented here is at the all-India level. The changes in the age structure are brought about by a demographic transition, including declines in mortality and fertility. The pace of the transition has varied across the country. Kerala was the first state to achieve replacement level fertility in 1988, followed soon by Tamil Nadu and Goa. By 2010, fertility in many states in the southern, western, northern, and eastern parts had fallen below the replacement level. Some other states joined these between 2011 and 2020.
The remaining states, most of which are in the north-central part, have also shown declining trends in fertility and are expected to reach a replacement level during this or the next decade. Their fertility will probably fall below replacement level soon after. Thus, all the states are expected to reach a peak population size and then begin a decline, and also undergo changes in age structure. However, the timings of such changes will depend on when the process of transition begins.
The UN does not provide population projections for states of India. Projections by the Technical Group on Population Projections (National Commission on Population 2020) do give state-level projections but only up to 2036. They are not useful to see future long-term trends in population size and age structure. However, for large states, population projections were made by the author up to 2101 under certain assumptions (Kulkarni 2021). These show that Kerala and Tamil Nadu, which completed their transition before 2000 (very early transition), are likely to reach a peak population size around 2040, if there is no heavy migration into these states.
Himachal Pradesh, Andhra Pradesh, Telangana, Delhi, Punjab, West Bengal, Karnataka, Maharashtra, Jammu and Kashmir, and Uttarakhand, which reached replacement level fertility between 2001 and 2010 (early transition), are likely to reach a peak during the mid-2040s. A third set of states, Odisha, Gujarat, Haryana, and Assam, which reached replacement level fertility between 2011 and 2020 (relatively late transition), are expected to do so during the 2050s or early 2060s. Finally, in Chhattisgarh, Jharkhand, Rajasthan, Madhya Pradesh, Uttar Pradesh, and Bihar, in which fertility had not reached the replacement level until 2020, it is projected to fall in the near future (very late transition). The populations of these states will grow for a longer time and reach a peak only after 2065.
Thus, growth, specifically, natural growth (the difference between births and deaths, not counting migration), will cease in the states leading in the transition before the middle of the century, but the population of states lagging in transition will continue to grow for a longer time, albeit at a slow pace. As a result, the populations of some states will grow more than that of others, affecting states’ shares in India’s population. This has implications for parliamentary representation and centre to state fund transfers, matters that have already become contentious.
To see how changes in the age structure in the future are likely to vary regionally, we first examine the share of the population in the working ages, 15 to 64, because this has relevance for the dependency ratio and demographic dividend. The trajectories of this share for the states by their timing of transition—very early, early, relatively late, and very late—are shown in Figure 1. Though the overall pattern of the projected change over time is similar for all the states, the trajectories vary with the timing of the transition.
In states that experienced a very early transition, the share of population in the 15 to 64 age group has crossed the 67% mark. Their peak dividend probably occurred around 2021, and the share is set to decline gradually and fall below 67% in the mid-2040s. States in the early transition category are also in the dividend phase, and after reaching their peak dividend in the late 2020s or early 2030s, will gradually exit the dividend phase.
[A]t any point of time, some states will be getting a high dividend, some states a moderate one, and some states will yet have to get it or are no longer getting it. Therefore, at any given time, the dividend will not be very high at the all-India level.
States that reached replacement level fertility during 2011-20 (relatively late transition) have also recently entered the dividend phase and are projected to get a high dividend in the 2030s and 2040s. Finally, states lagging in transition (very late transition) will enter the dividend phase only in the 2030s, and a high dividend would be available to them around the middle of the century. The dividend will peter out by the mid-2060s.
Because the transition is staggered, by the time the states lagging in transition begin to get a high dividend, the leading states would have exited the dividend phase. This means that, at any point of time, some states will be getting a high dividend, some states a moderate one, and some states will yet have to get it or are no longer getting it. Therefore, at any given time, the dividend will not be very high at the all-India level.
This is in contrast to China, which derived a high dividend for some years during the first two decades of this century, with the share of the working age group rising above 72% and the dependency ratio falling below 40%. Fertility decline was very steep in China, especially in the 1970s, and correspondingly, the rise in the share of the working age population was sharp. Indian states with very early transition and early transition come close to this pattern with the share of working ages staying marginally over 70% for one or two decades. For states lagging in transition, the pace of fertility decline is rather slow and the share of the working age group is not likely to cross 70%. Yet, all are set to enter the dividend phase or have already been in it.
The trajectories of the share of the elderly in the population will show a monotonic rise in all regions but at a varying pace, depending on the timing of the transition (Figure 2). Ageing will be higher in the states that experienced an early transition than in those lagging behind in transition. Thus, some regions will have to prepare earlier than others to make provisions to support the elderly. Since the early transition states are economically more developed, they are in a fairly comfortable position to do so. The other states can benefit from the experience of the leaders to develop their programmes.
What are the implications of the spatially staggered changes in age structure? One, as noted above, India will never get a very high dividend. Though India’s dividend will not be as large as that derived by China, there will be a moderate dividend for a longer period. This is akin to the elephant versus dragon debate in the context of economic development in India and China.
It is known that conspicuous in-migration often creates issues such as “locals versus outsiders” and political factors come into play.
Second, over time, as the share of the working age group rises in some regions, it will fall in some others, as seen in Table 2. This pattern can be fruitfully utilised if workers from regions with a high working age population move to areas where such a population has begun to fall. After the 2040s, the working age population is set to decline in the states that experienced very early and early transition while it will rise in the states trailing in transition.
Table 2: Projected Changes in Population of Ages 15 to 64 for Large States of India during 2001 to 2101 (Different time periods, Population in thousands)
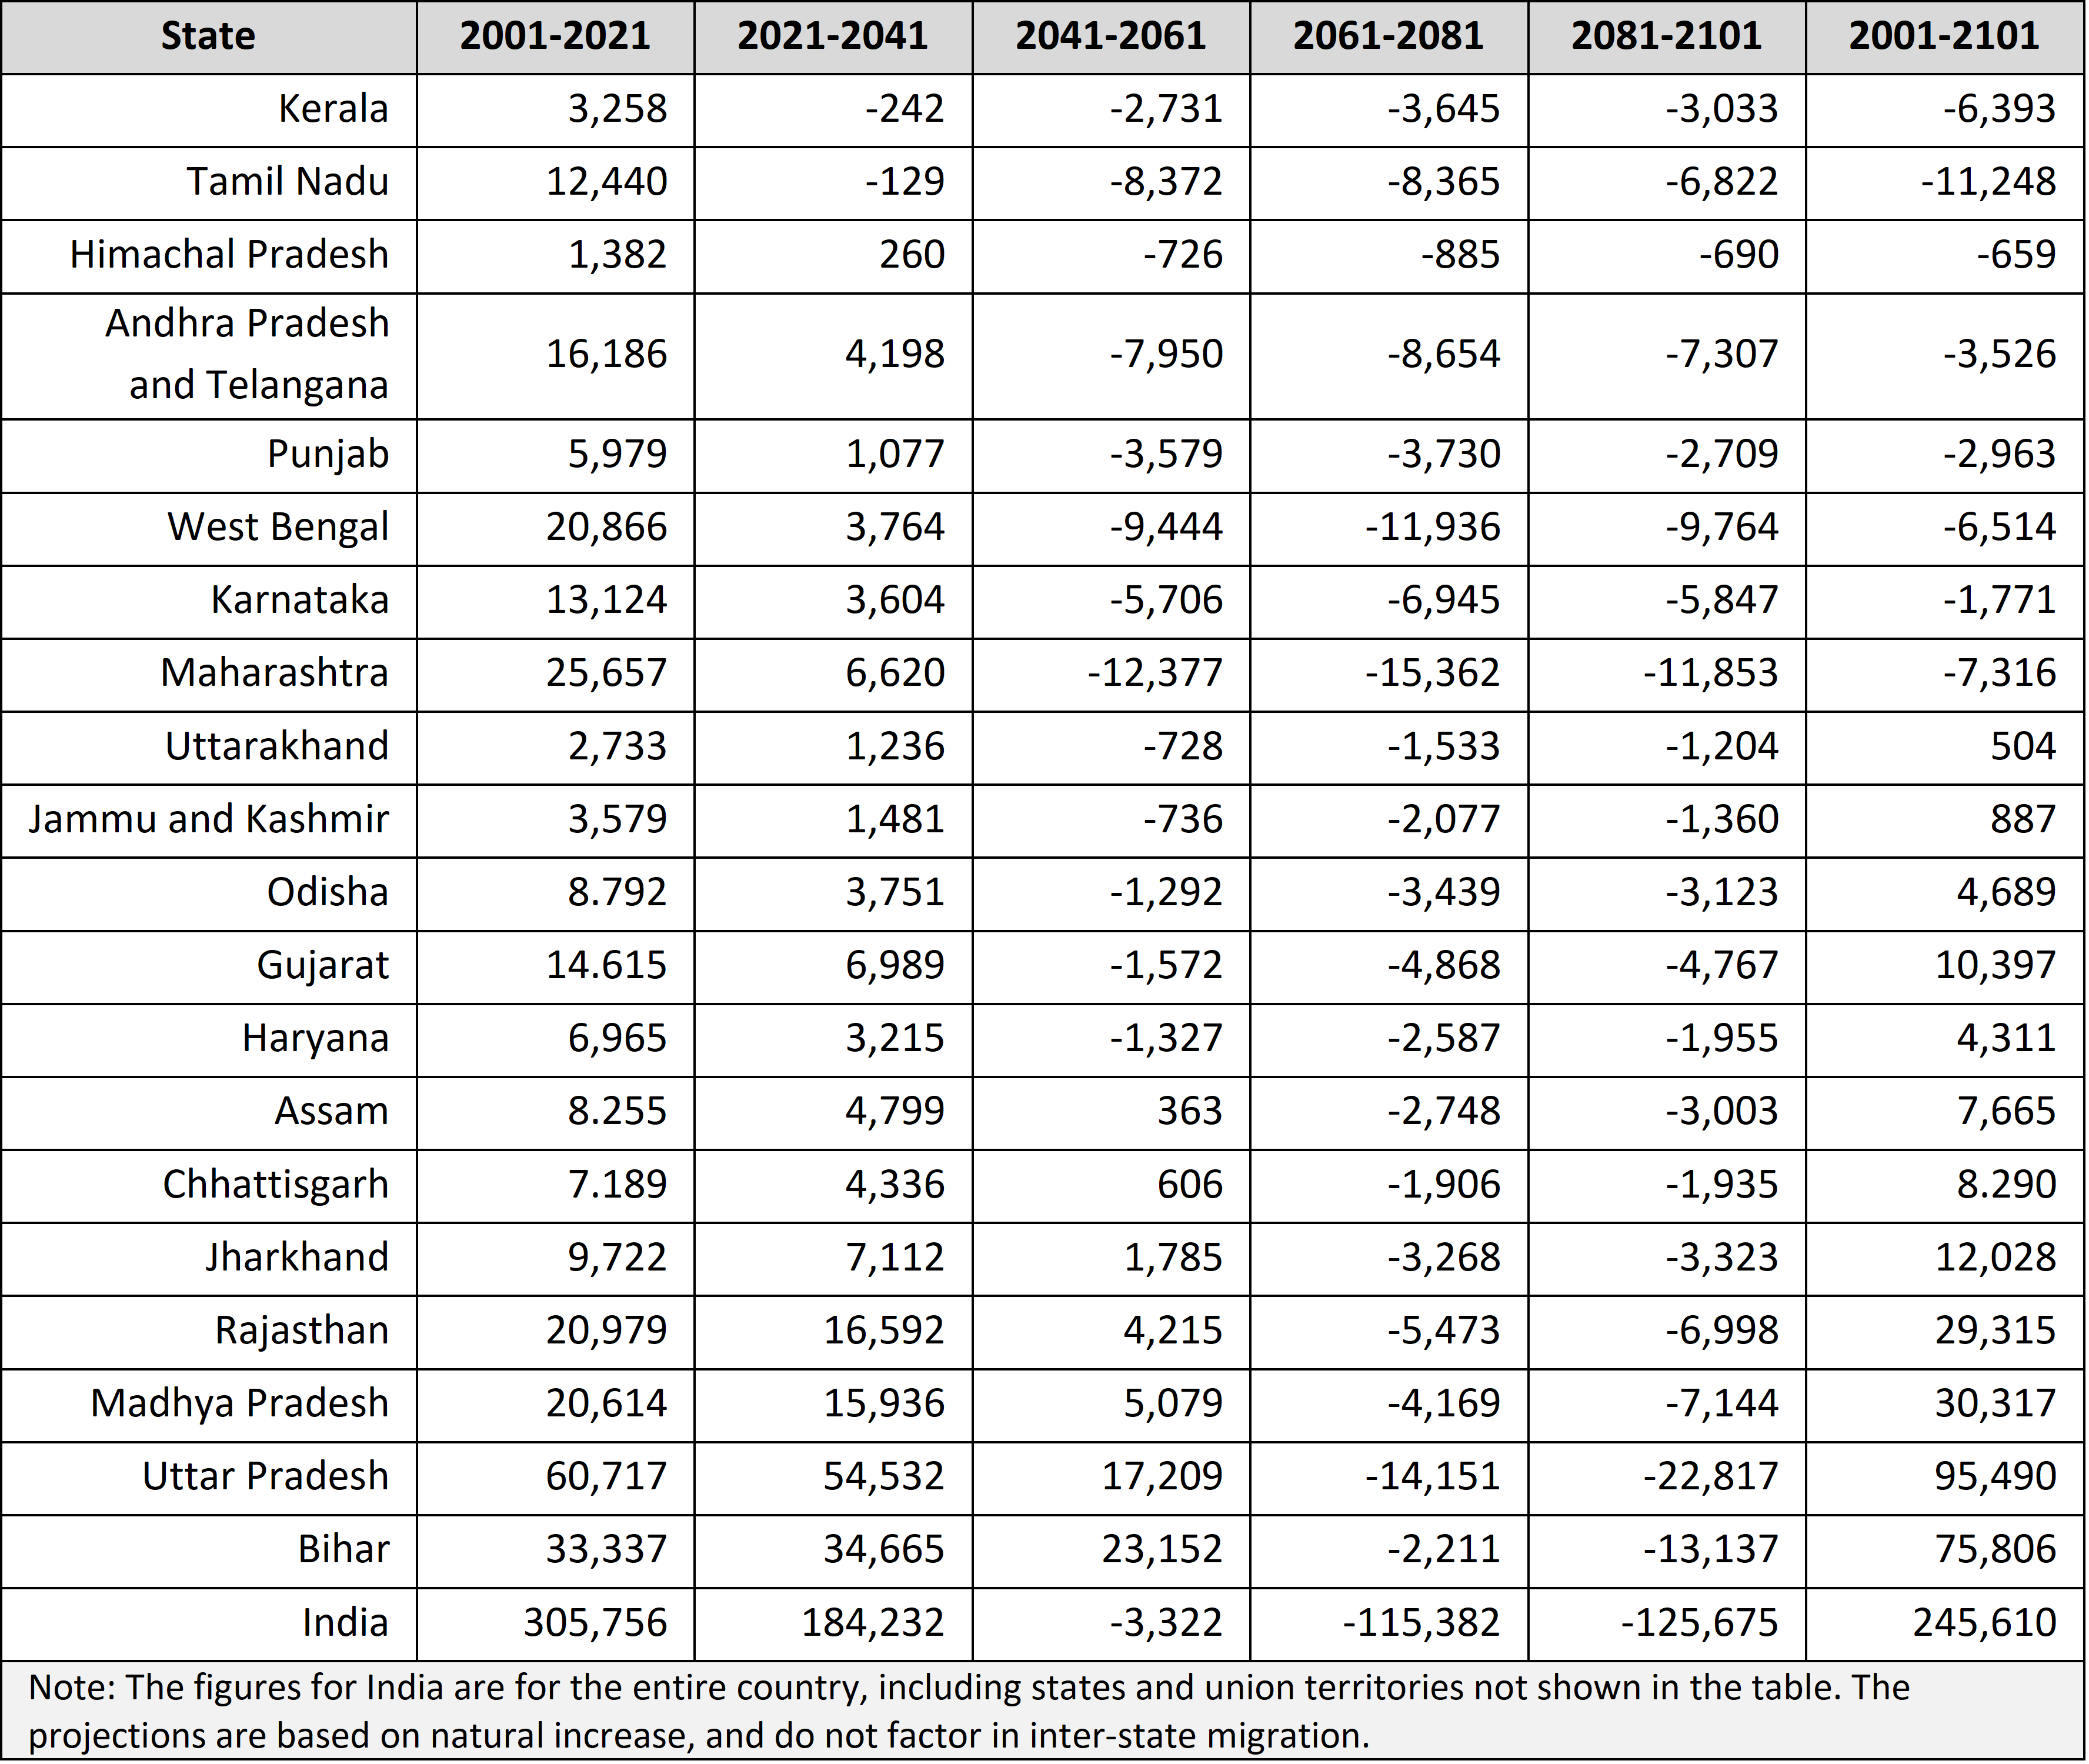
Migration of workers from the latter group of states to the states ahead in transition can, in principle, be complementary in nature. But this means large-scale inter-state migration of labour. It is known that conspicuous in-migration often creates issues such as “locals versus outsiders” and political factors come into play. Therefore, a broad consensus is essential to ensure that such migration does not place the migrants in a vulnerable position and is well received by the native population.
Whereas rapid population growth was a major policy issue in India in the past, harvesting the demographic dividend efficiently, developing systems for elderly care, addressing inter-state growth imbalances, and facilitating large-scale inter-state migration in a smooth manner are going to be the challenges for political and societal leaders in the present century.
Purushottam M Kulkarni was professor in population studies at the Jawaharlal Nehru University and is currently based in Bengaluru.