The 77th round of the nationwide National Sample Survey Office (NSSO) survey for 2018-19, released in September 2021 as NSSO Report No. 587 (GoI 2021), explores the land and livestock holdings of rural households and carries out a situation assessment of agricultural households. The survey canvassed 58,035 rural households in more than 5,940 villages two times—during July-December 2018 and January-June 2019—to cover the full agricultural cycle for 2018-19.
The focus of our analysis are 45,716 “agricultural households”—defined as those [i] with at least one family member self-employed in and [ii] earning at least Rs. 4,000 a year from farming and/or animal husbandry. Of the remaining, many were engaged in agriculture but violated one of the two conditions. As Table 1 shows, state-level sample sizes, selected by a stratified two-stage random design, are good enough to yield robust inferences.
Table 1: Villages and households surveyed
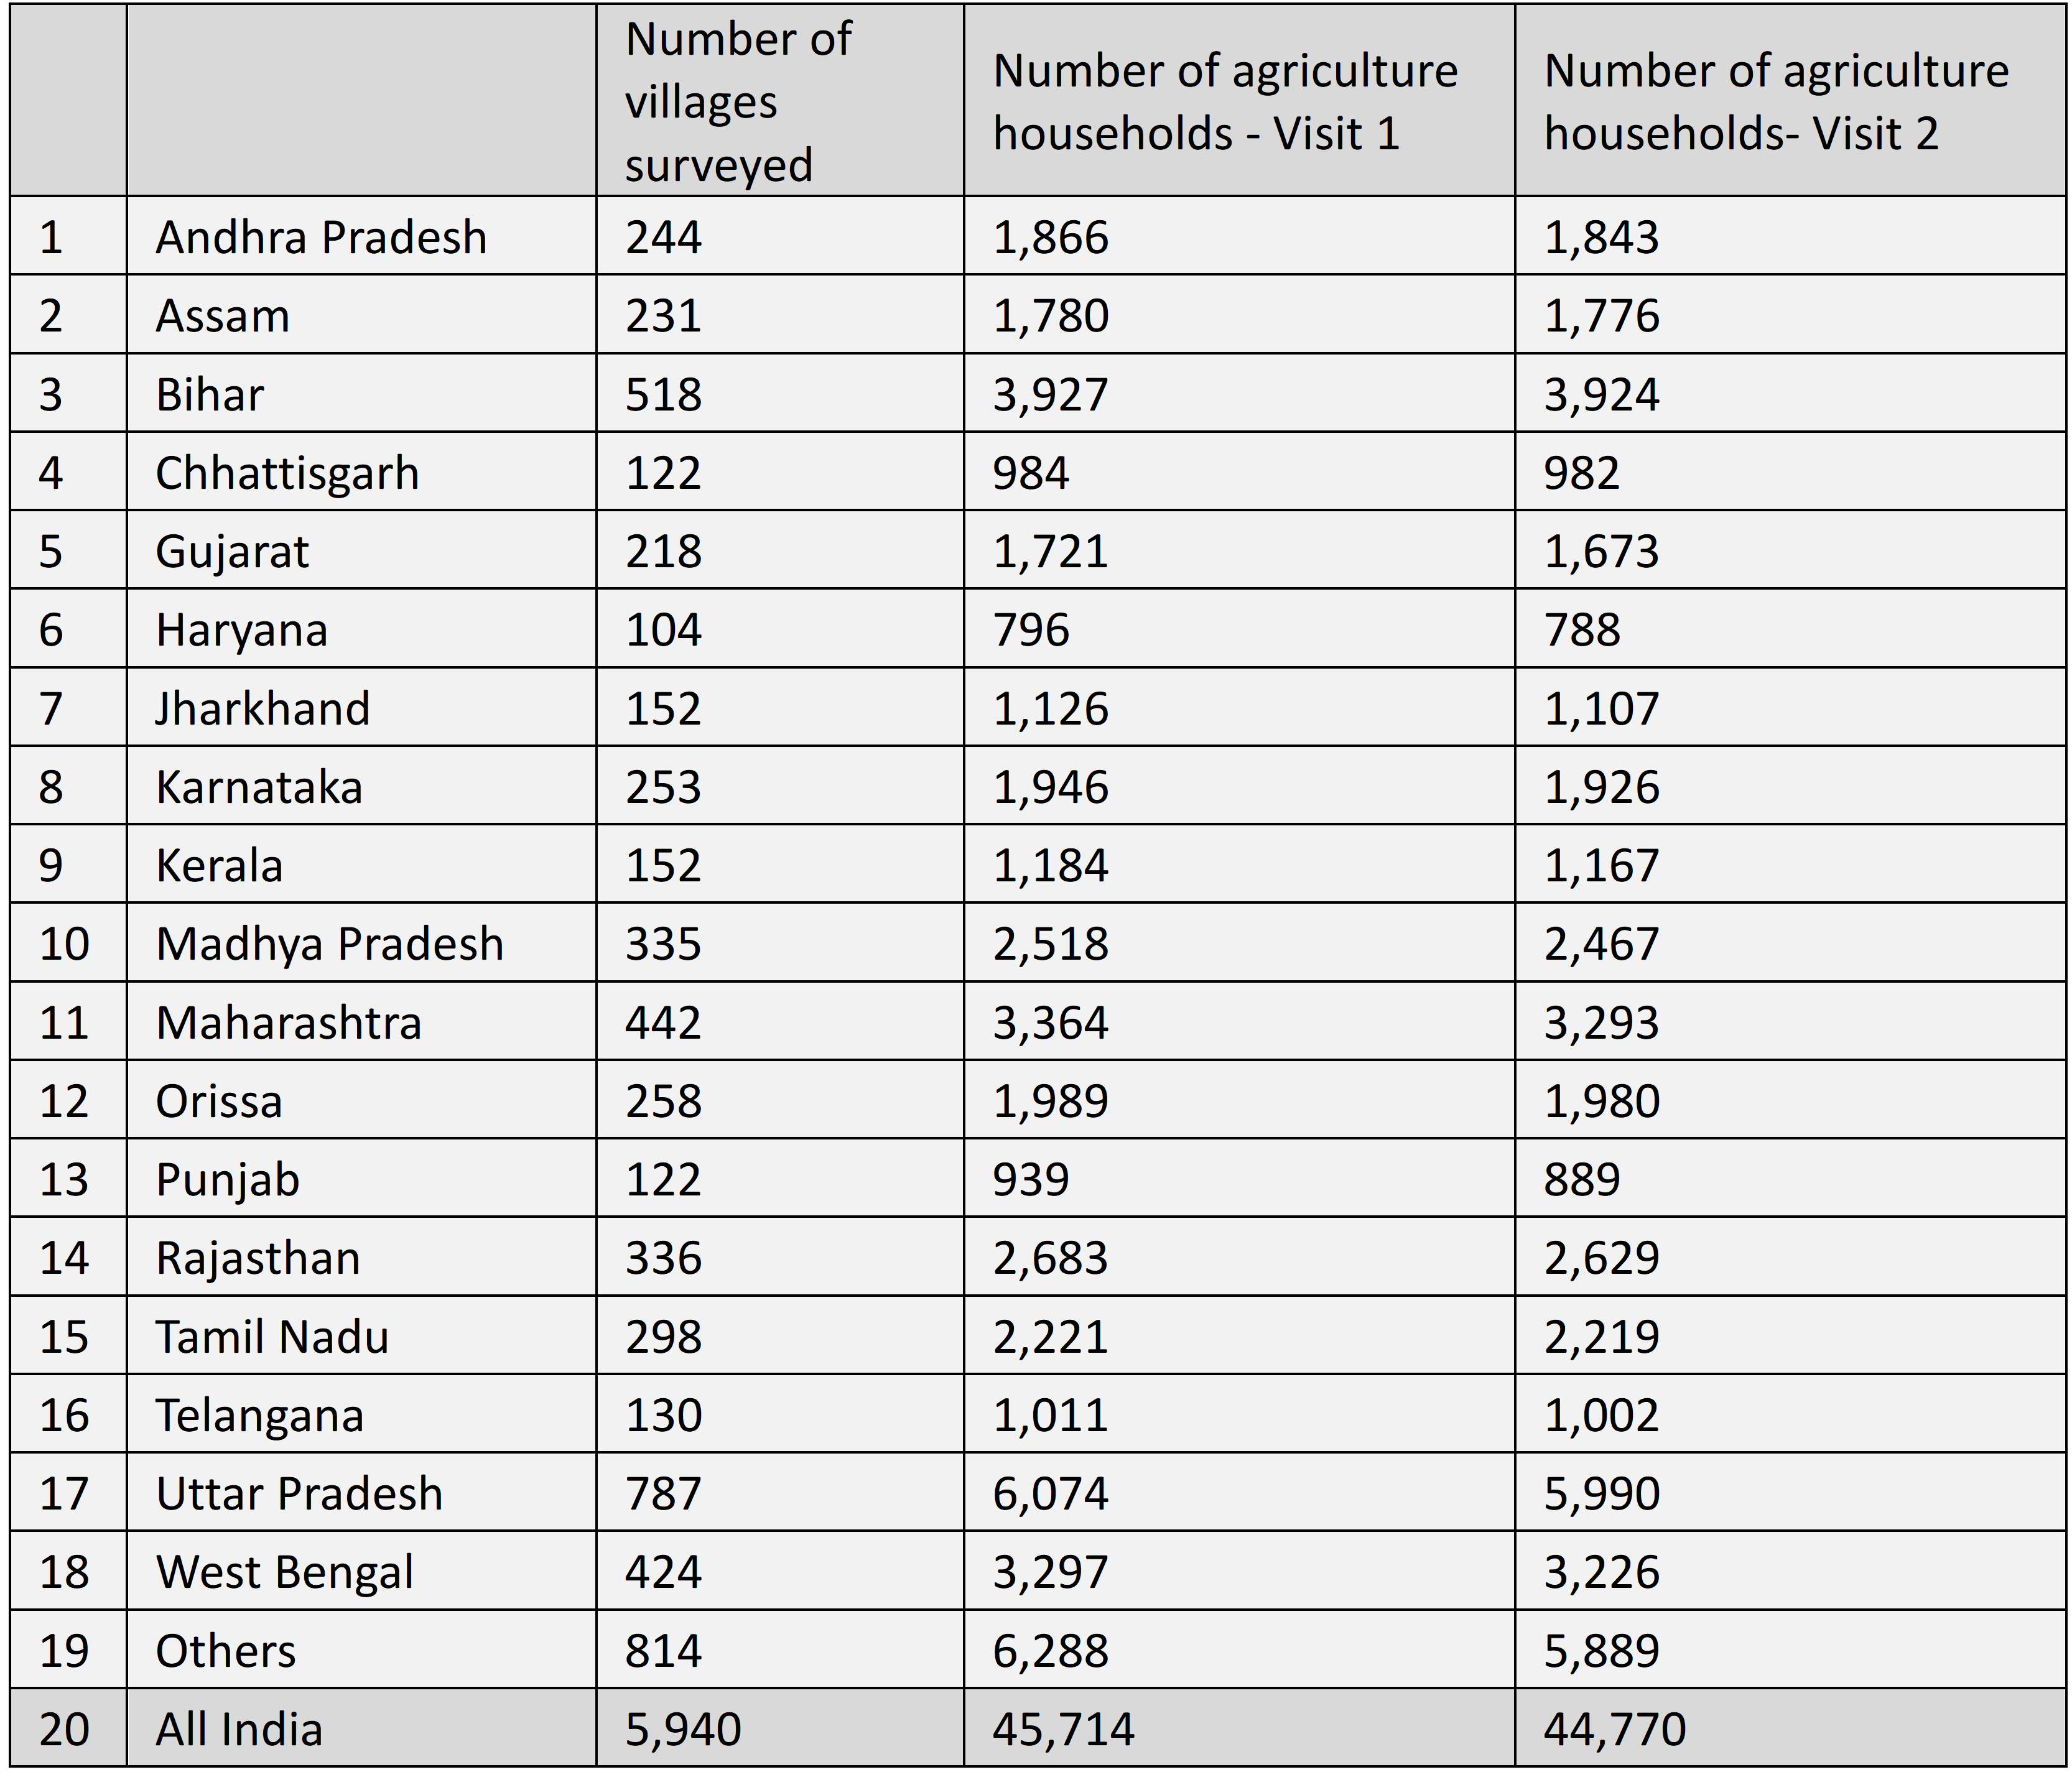
The survey questions, organised in 16 blocks, sought more than 970 details, most unrelated to irrigation. However, some questions in blocks 5, 7 and 16 related to irrigation. A high measurement error is a likely hazard. But the data is by far the most recent we have; the survey covers all states with a large sample of more than 45,700 farm households; and it explores aspects that no other data set does.
Irrigated Area versus Irrigating Farmers
The Bharatiya Janata Party (BJP) government came to power in 2014 with the goal of Har Khet Ko Pani (water to every field). Is the country making headway in this direction? The 77th round survey shows that India has done better in achieving har kisan ko pani (water to every farmer) rather than har khet ko pani. Across all states, the proportion of farmers with access to irrigation was higher than the proportion of cropped area under irrigation during the two six-month periods covered by the survey (Figure 1).
In India’s monsoon climate, kharif crops are supposed to be rainfed while rabi and summer crops depend on irrigation. The survey confirmed this for peninsular India but not for the Indo-Gangetic basin where irrigation has become a year-round affair.
The Jharkhand, Assam, Kerala, and Orissa samples had more than 60% farmers with access to irrigation but less than a quarter of their cropped area under irrigation. The Indo-Gangetic basin states—Punjab, Haryana, Bihar, Uttar Pradesh (UP), and West Bengal—were, however, a class apart. These scored very high on both area under irrigation and farmers using irrigation.
Fig. 1: State-wise distribution of irrigated area and irrigating cultivators
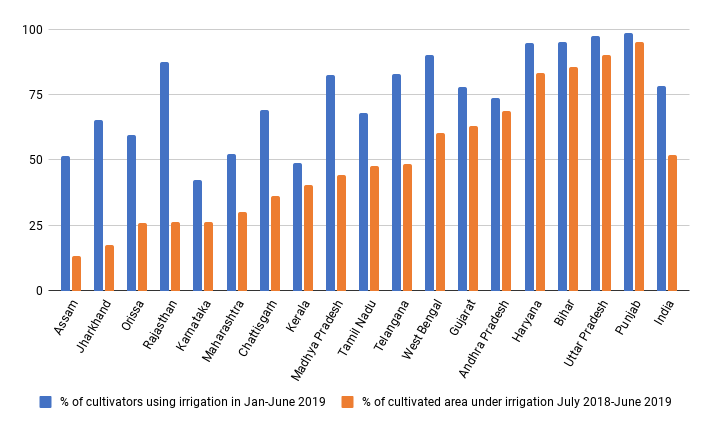
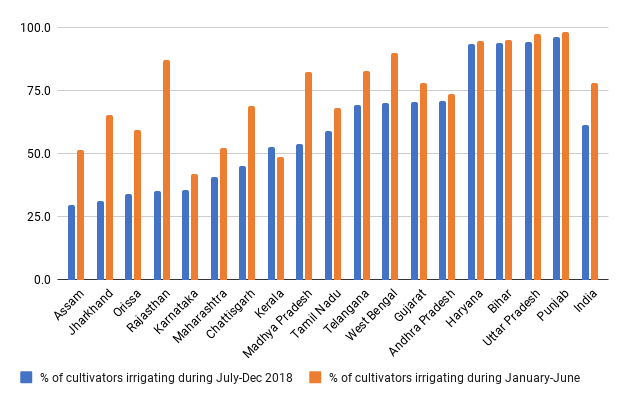
Fig. 2: Irrigation during dry and wet season
In India’s monsoon climate, kharif crops are supposed to be rainfed while rabi and summer crops depend on irrigation. The survey confirmed this for peninsular India but not for the Indo-Gangetic basin where irrigation has become a year-round affair.
At the national level, 78% farmers irrigated during the dry months (January to June 2019) against 61% during the June to December 2018 period. Kharif rainfed farming still persisted on a significant scale in Assam, Orissa, Karnataka, Chhattisgarh, and Madhya Pradesh. The surprise, however, was the Indo-Gangetic basin where more than 95% of farmers irrigated during both the periods. It was commonly believed that kharif paddy in Bihar and amon rice in West Bengal were rainfed. However, 77th round data shows this is not the case any longer, most likely because of frequent mid-season dry spells because of climate change (Figure 2).
From Surface to Groundwater
Ever since the 1830s, government canal systems and community-managed irrigation tanks dominated Indian irrigation, with groundwater playing a supplementary role. This began to change with the coming of the green revolution. The number of groundwater wells since then has proved unstoppable, with public and community management of irrigation giving way to farmer-managed atomistic irrigation. That the 77th round accurately portrays this previously well-documented trend (Figure 3) suggests that it does broadly capture the reality of Indian irrigation.
A key policy lesson from the 77th round? Governments must target promoting the conjunctive management of ground and surface water at the farm, catchment, and basin levels.
Private wells have cannibalised canals in the Indo-Gangetic basin, and canals and irrigation tanks in peninsular India. Groundwater dominance is associated with high irrigation intensity and agricultural dynamism. In contrast, reliance on surface irrigation has become a marker for agricultural stagnation. Thus surface systems still remain important only in the least irrigated states such as Orissa, Andhra Pradesh, Chhattisgarh, and Jharkhand.
Fig. 3: Relative share of groundwater in irrigated area (%)
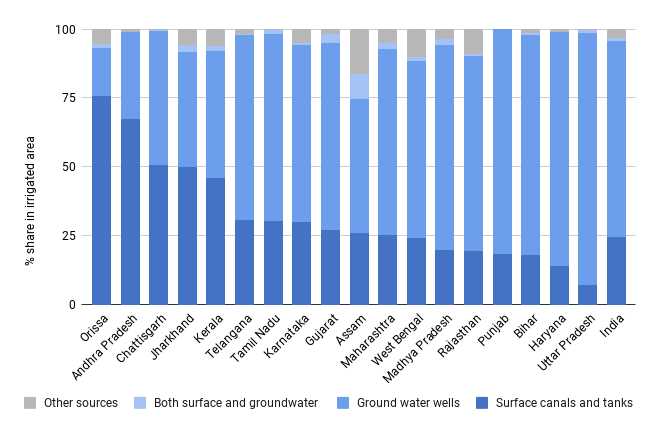
Groundwater depletion has emerged as a collateral damage of intensification. Elsewhere in the world, the conjunctive use of surface and groundwater is seen as the best antidote to groundwater depletion. The 77th round survey puts the poor state of such conjunctive water use in much of India into bold relief. In all states, except Assam, less than 3% of the irrigated area uses both surface and groundwater in a conjunctive mode, suggesting an unsustainable dependence on groundwater. A key policy lesson from the 77th round? Governments must target promoting the conjunctive management of ground and surface water at the farm, catchment, and basin levels.
Irrigation Service Markets
Fig. 4: Percentage of cultivators who purchased irrigation from non-government source during Jan-June 2019
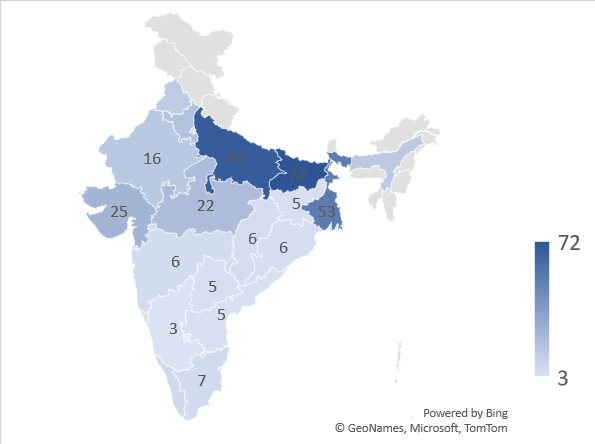
Block 7 of the survey instrument solicits information on sources of farming resources’ such as fertilisers, manures, pesticides, seeds, animal feeds, veterinary services, and, finally, irrigation. The generic sources listed for all inputs include “own farm”, “local market”, “APMC market”, “input dealer”, “cooperative”, “government agencies” and “others”. The responses on “irrigation” are noteworthy. For the national sample, 26% and 30% of the respondents, respectively, reported “local market” and “others” as their source of irrigation (Figure 4).
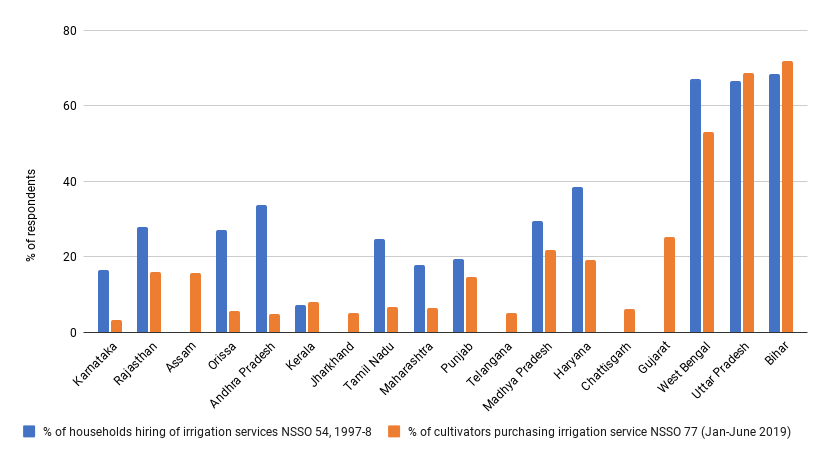
Fig. 5: Dependence on irrigation service markets in NSSO 54 (1997-8) & NSSO 77 (2018-9)
The study of irrigation service markets (ISMs) in India began during the 1980s when they had already become vibrant and pervasive in many parts of India, Pakistan, and Bangladesh. Irrigation service markets referred essentially to informal village-level economic institutions in which private owners of wells and tubewells provided irrigation services (or rented equipment) to others for a consideration. They attracted much attention because of their pervasiveness and their scope for improving irrigation access to poor owner and tenant farmers.
An early assertion was that irrigation service markets were more “mature” in western and southern India than in eastern India (Shah 1993). However, this was challenged by Mukherjee (2004), who claimed that they were more pervasive in eastern India than believed so far. Mukherji compared NSSO round 31 (1976-77) with round 54 (1997-98) to gauge the changes in significance of irrigation service markets across states. However, the two datasets had limited comparability because the 31st round reported on “% of pumps rented out” while the 54th round reported “% of households [who] hired in irrigation services”.
The 54th round dataset is more comparable to the 77th round since both report on buyers of irrigation service. Figure 5 shows that in the 20 years between the two rounds dependence on irrigation service markets sharply declined in all the states except in the eastern Ganga basin, where they continue to be the mainstay of agriculture.
Fig. 6: Size of irrigation service market (Rs cr/year)
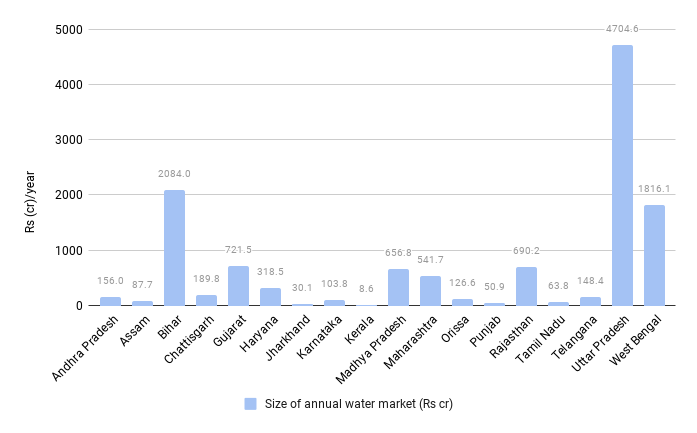
The survey also asked respondents to report on their monthly spending on various farm inputs, including irrigation. Based on these, Figure 6 reports estimates of the size of the irrigation service markets in different states of India. Farmers of UP, Bihar, and West Bengal—accounting for 68.8% of the national farmer payout for purchased irrigation—spend several times more on purchased irrigation than farmers of other states. However, the figures are much smaller than one would expect. And a likely reason is a possible measurement error caused by respondent confusion.
Why have irrigation service markets become such a powerful and pervasive irrigation institution in the eastern Ganga basin and declined elsewhere? Several factors may be at work.
In the same block, the survey also asked farmers to report separately on “all other expenses [which] include diesel, electricity, cost of hiring machinery and equipment for crop production, cost of crop insurance and any other expenses for crop production” (GoI 2021: footnote to Table 5.3A, p. 88). These “other expenses”, which include hiring pumps and tubewells, are four to five times larger than the expenses reported on purchase of “irrigation”. This is likely to have confused many respondents, and the result is that the reported expenses on purchased “irrigation” are likely a fraction of the actual spend.
Why have irrigation service markets become such a powerful and pervasive irrigation institution in the eastern Ganga basin and declined elsewhere? Several factors may be at work. Groundwater wells with electric pumps enjoying subsidised electricity have increased rapidly in the western and southern states, reducing the number of “pump-less” farmers needing purchased irrigation. At the same time, with runaway depletion of water tables, well owners, especially in hard rock areas, have become increasingly reluctant to sell “their” scarce water.
The eastern Gangetic plains present a sharp contrast. Here, groundwater is available aplenty; and diesel pumps that dominate irrigation can easily circulate among farmers. However, by far the most important factor that makes irrigation service markets so pervasive in the eastern Gangetic basin is the extremely high fragmentation of land, combined with extensive tenancy. The 77th round reports an average of four parcels per holding in Bihar, West Bengal, Jharkhand, and Orissa, and fewer elsewhere.
In the arid alluvial aquifers of Punjab, Haryana and western UP, shallow borewells have given way to deep tubewells that chase secularly declining water levels, which are made possible by debilitating and perverse energy subsidies.
However, this is a serious underestimate of land fragmentation in Ganga basin. During my own fieldwork in some 30 villages of north Bihar, most farmers reported eight to 20 parcels per holding, scattered all over the village (Shah 2023). Most farmers have a borewell and pump water in their largest and best parcel but buy irrigation for the rest. Moreover, seasonal or long-term tenant farmers invariably buy irrigation.
Since the fragmentation of land as well as tenancy in the Ganga basin are unlikely to change in a long time, irrigation service markets will continue to rule irrigated agriculture in the Ganga basin. No strategy for irrigation development can work here unless it succeeds in giving irrigation service markets a pro-poor orientation.
Physical versus Economic Water Scarcity
Thanks to decades of excessive groundwater withdrawals, much of western and southern India suffers from acute physical water scarcity. In semi-arid peninsular India with hard rock aquifers, millions of irrigation wells dry up during summer. In the arid alluvial aquifers of Punjab, Haryana and western UP, shallow borewells have given way to deep tubewells that chase secularly declining water levels, which are made possible by debilitating and perverse energy subsidies.
The Eastern Gangetic basin has the opposite problem. It overlies one of the world’s richest alluvial aquifer systems. The Ganges Water Machine hypothesis (Ravelle and Laxminarayana 1975) proposed that pulling down groundwater levels during the dry months here can enable the Ganga basin’s porous alluvial aquifer system to partially absorb the vast summer surface flows from snow melt and rainfall as groundwater recharge, and ease widespread flooding and water logging in eastern UP and Bihar. Groundwater intensification here can arguably not only improve agrarian livelihoods but also reduce the fury of annual floods.
Fig. 7: Percentage of farmers reporting paddy crop losses in Bihar and Punjab (NSO 77th round: June-Dec 2018)
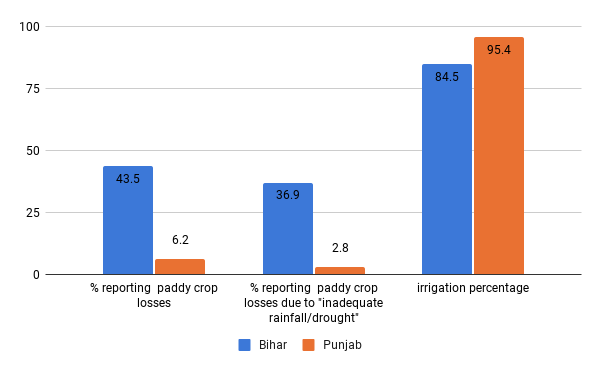
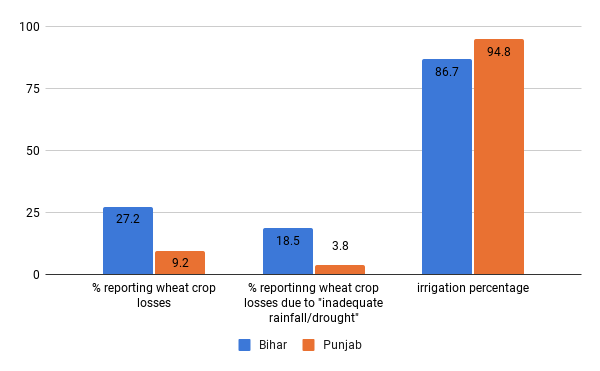
Fig. 8: Percentage of sample farmers reporting wheat crop losses (NSO 77th round: Jan-June 2018)
The problem in Bihar, UP, and West Bengal, however, is of economic water scarcity. As Figure 5 showed, the average farmer here spends three to four times more on irrigation than farmers elsewhere in India. Thanks to costly irrigation, farmers of the Ganga basin refrain from optimally using the region’s abundant groundwater for optimising paddy and wheat yield and, more importantly, irrigating high-value cash crops during summer.
Although fertiliser use by Bihar and UP farmers is higher than the national average, they harvest 40% less rice and wheat yield/hectare than Punjab-Haryana farmers because they under-irrigate. A field investigation of 7,848 fields in 40 districts of Bihar, eastern UP, and Odisha in 2017-18 concluded that their wheat yield of 3.5 metric tons per hectare (MT/ha) could approach Haryana’s yield of 5.1 MT/ha with an additional irrigation each at the flowering and milking stages (Singh et al. 2019).
The 77th round survey supports this inference, as Figures 7 and 8 show, suggesting that water stress reduces rice and wheat yields more in Bihar than in Punjab. While the proportion of farmers irrigating paddy and wheat in Bihar was only marginally smaller than Punjab, the proportion who reported paddy and wheat yield losses were more than three times higher in Bihar; and those reporting yield losses due to “inadequate rainfall/drought” were similarly higher in Bihar than in Punjab.
In sum, the 77th round survey suggests that the irrigation challenge of the Ganga basin is not one of physical access but of economic access. Making irrigation affordable can help farmers here not only harvest better crop yields but, more importantly, expand summer cropping of irrigated high-value crops instead of leaving land fallow or using it for rainfed mung and fodder (Shah 2024).
Irrigation versus Crop Insurance
The 77th round also sought farmers’ responses on the reasons for crop loss in all the important crops they grow. The options were “inadequate rainfall or drought”, “flood”, “pests and diseases”, and “other”. There is room for a disaggregated analysis here; but we just explore the national dataset.
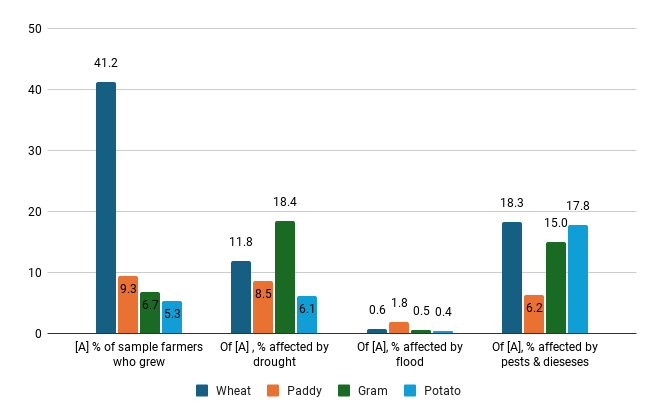
Figures 9 and 10 summarise the results for the entire sample for the four most widely grown crops by all sample farmers during the two periods. Paddy was by far the most widely grown crop during kharif while wheat was the most popular during the dry season. Naturally, the picture varied across states. But the national picture shows that “inadequate rain/drought” was the most important reason for crop losses during the kharif season of 2018-19 while “pests and diseases”, counter-intuitively, caused higher crop losses during the dry season of 2019. Floods were the least important reason for crop losses.
Fig. 9: Sources of crop production risk: June-Dec 2018 (NSSO 587: table 4.13, p 80)
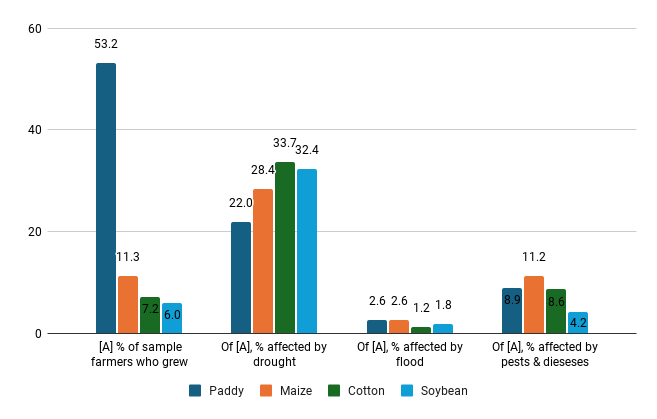
Fig. 10: Sources of crop production risk: Jan-June 2019 (NSSO 587: table 4.13, p 80)
Did the Prime Minister Fasal Bima Yojana (PMFBY) help mitigate farmers’ risks? The 77th round explored this question too. It asked if the respondents had taken additional crop insurance other than the mandatory crop insurance attached to crop loans. The year 2018-19 was the heyday of the PMFBY and a sizeable proportion of the sample farmers claimed they had obtained “additional crop insurance”.
Fig. 11: Percentage of farmers who took additional insurance, suffered crop losses but received no claim June-Dec 2018 NSO 587 table 4.14, p 81
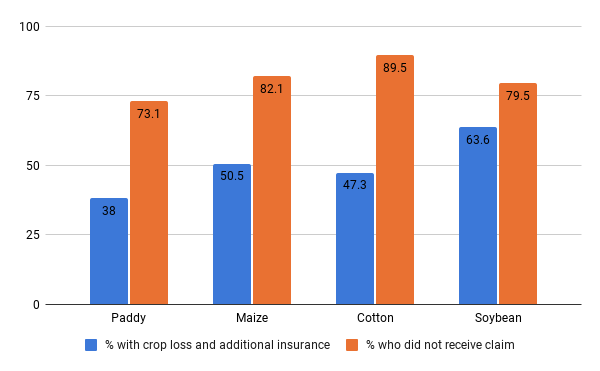
Fig. 12: Percentage of farmers who took additional insurance, suffered crop losses but received no claim June-Dec 2018 NSO 587 table 4.14, p 81
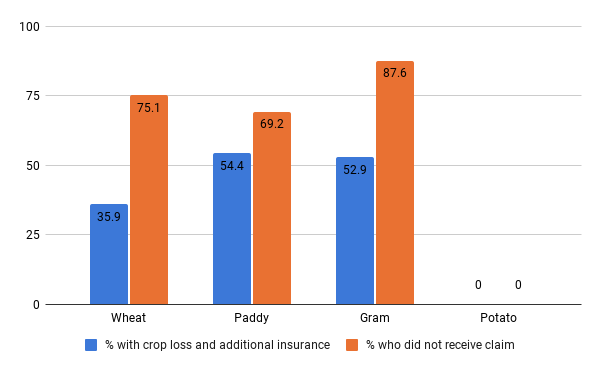
Figures 11 and 12 report the percentage of sample farmers who reported crop losses and had taken additional insurance, and the proportion of them who were denied compensation. The data suggests that getting compensation for crop losses even with additional insurance was more an exception than a rule in 2018-19, and this shows why enrolment for the PMFBY has steadily declined over the years.
The survey also explains why Punjab and Haryana opted out of the PMFBY—their farmers, fully protected by irrigation, suffer almost zero crop loss due to moisture stress. Since “inadequate rainfall/drought” is the predominant reason for crop losses, securing irrigation-on-demand appears a more reliable antidote to crop losses than crop insurance.
Conclusions
Irrigation-related questions are but a small fraction of the NSSO 77th round survey. However, the dataset permits exploration of aspects of India’s irrigation economy that have otherwise remained unexplored. Its large sample size of 45,716 agricultural households, robust sampling methodology, and two visits over 2018-19 that covered the kharif as well as dry season present a unique opportunity to understand India’s irrigation economy. This brief article has presented just a first-cut analysis.
Data on the extent and sources of crop losses and the degree to which crop insurance covered production risk present an invaluable opportunity for useful analysis across states and agro-climatic zones.
Much more can be obtained from the dataset. The NSSO does provide researchers with access to district-level datasets to undertake a more granular analysis. With district-level datasets, it is possible to undertake a comparative analysis across agro-climatic or hydro-geological zones, instead of just an inter-state comparison, as we have attempted here. The dataset permits analysis of irrigation access and practices across crops, social groups, and holding sizes.
Estimates of irrigated area—net and gross—based on figures published by the Ministry of Agriculture, Central Water Commission, Minor Irrigation Census, and Agricultural Census, vary by a large margin. It might be instructive to compare estimates based on the 77th round with other data sources to add some clarity on this important matter. Data on the extent and sources of crop losses and the degree to which crop insurance covered production risk present an invaluable opportunity for useful analysis across states and agro-climatic zones. Finally, making reasonable comparisons of 77th round with the 70th round, the 54th round, and even earlier rounds would throw light on the evolution of India’s irrigation economy during recent decades.
Tushaar Shah (t.shah@cgiar.org) is Scientist Emeritus at the International Water Management Institute and Professor Emeritus at the Institute of Rural Management, Anand.