B.R. Ambedkar, chairman of the drafting committee of the Constitution and India’s first law minister posed, with characteristic eloquence, the key challenge facing the new republic: the superimposition of formal equality (one person, one vote) on a society with substantive inequality, which was most starkly evident in the hierarchy of the caste system. How does a nation move from equality in law towards equality in fact?
The answer was to carry forward the system of quotas that certain British territories and princely states had instituted for allowing the entry of untouchables, the most stigmatised jatis (social groups) at the bottom of the caste hierarchy, to higher education and public employment.
After Independence, untouchability was abolished legally, and jatis and tribes were identified as eligible for India’s reservation system, a policy of compensatory or positive discrimination for the wide range of social and economic disabilities they suffered because of marginalisation, discrimination, and, most notably, untouchability. These are the Scheduled Castes, or SCs, of today.
Researchers have tried to gauge the impact of reservations on various outcomes. The big picture verdict is that it has benefited SCs and STs as a whole.
Most of the tribal population of India was not included in the list of depressed classes from colonial times, and most tribal groups were not earmarked as a group to be afforded affirmative action in the first report on minority rights in 1947. The scheduling of these tribes and the creation of an inclusive schedule for these tribes took place in 1950. These are the Scheduled Tribes, or STs, we have now.
Given the salience of the reservation policy, formally supported by the entire political spectrum, one would have expected successive governments to have tracked outcomes, introduced self-liquidating features where needed, and added new features when required. In other words, make the policy malleable for maximum benefit, keeping in mind the larger goal of moving towards equality-in-fact, or substantive equality.
Surprisingly, or perhaps not so surprisingly, this has not happened. However, researchers have tried to gauge the impact of reservations on various outcomes. The big picture verdict is that it has benefited Scheduled Castes and Scheduled Tribess as a whole.
A recent Supreme Court verdict has tried to uncover two main layers within the policy. One, have some jatis benefited more than others? If yes, do we need to subdivide the SC quotas into sub-quotas for jatis?
Indeed, this is not the first time that the subdivision of the Scheduled Caste quota, or quota-within-quota, is sought to be introduced. We have examples from two states, Punjab and Bihar, where subdivisions exist, and another example from Andhra Pradesh, where subdivisions were in place briefly.
Whether or not to subdivide the overall quota between specific jatis is an empirical question, as the Supreme Court also notes. In this article, we examine the case for subdivision by focusing on six major states.
Interstate variation
Unfortunately, authoritative official jati-level data on select indicators are available for the Scheduled Castes only in the decennial censuses, the last of which was conducted in 2011. Data from this census is now too old, but the census that was due in 2021 has been put off.
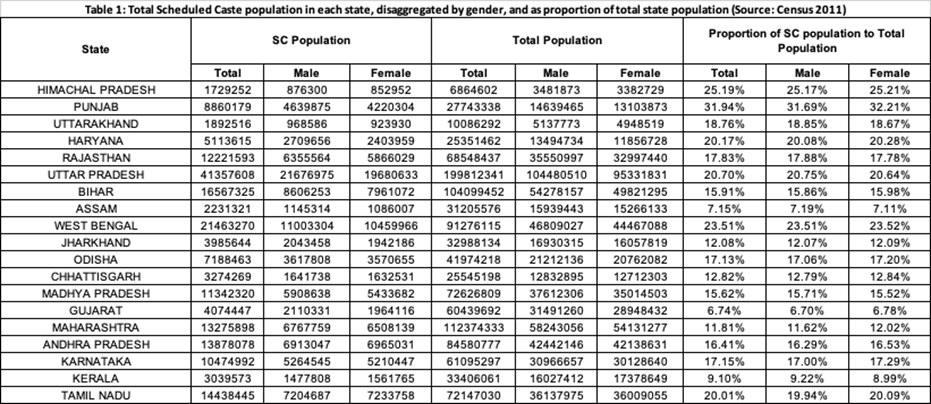
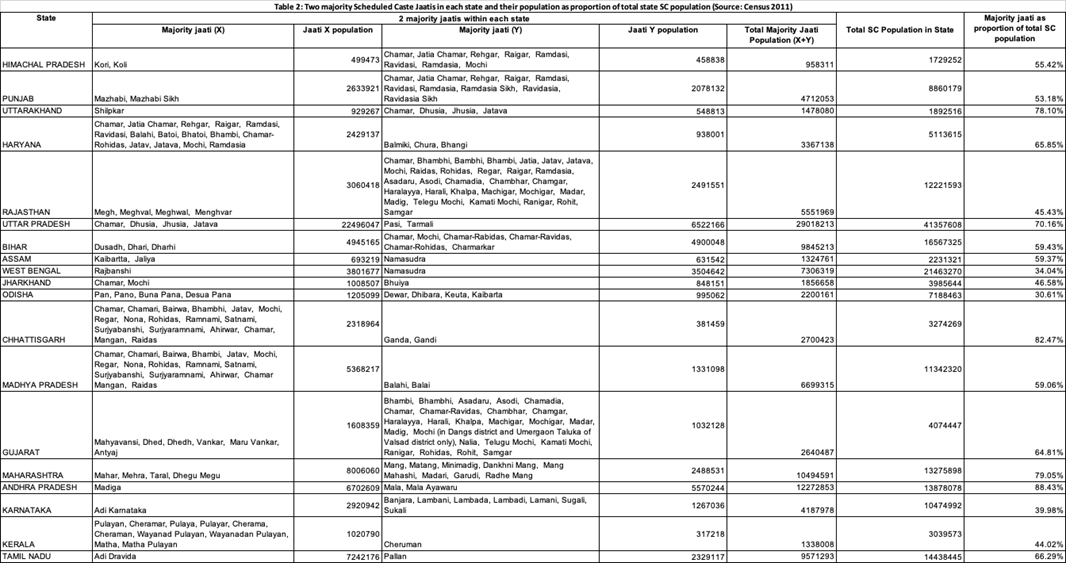
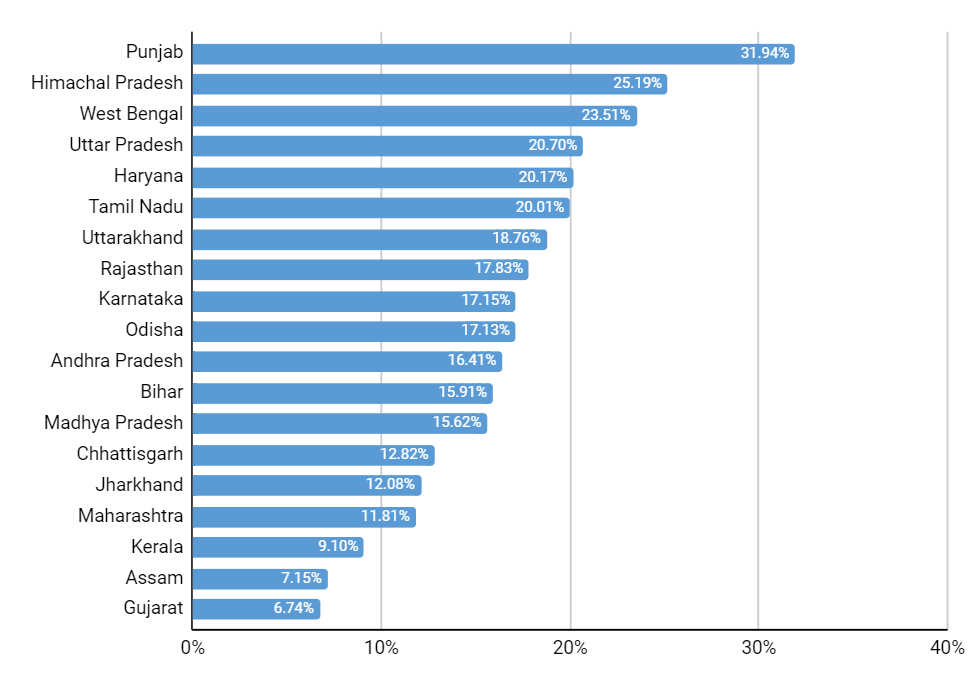
Figure 1 presents the proportion of Scheduled Castes in the total population of major states from the 2011 census. While the national proportion is roughly 16–17%, we note a great deal of interstate heterogeneity in the Scheduled Caste proportion, which varies from a low of roughly 7% in Gujarat to a high of nearly 32% in Punjab. (Table 1 in the Appendix has more details.) In each state, the majority of the Scheduled Caste population consists of two major jatis, with the rest divided into several small jatis. (Table 2 in the Appendix lists the major jatis included in the Scheduled Caste list by state.) Thus, even before considering subdivision of the quota within Scheduled Castes, a revision of the reservation policy could consider making the quota proportional to the state population.
For this piece, we have chosen six states for our analysis, keeping in mind the following criteria. The grounds for choosing the states are a) high Scheduled Caste proportions (not necessarily the top six), b) regional spread, and c) the fact that some of these states have experimented with Scheduled Caste subdivision. These states are Andhra Pradesh (with a 16.41% SC population); Bihar (15.91%); Punjab (31.94%); Tamil Nadu (20.01%); Uttar Pradesh (20.7%) and West Bengal (23.51%).
Figure 1: Proportion of Scheduled Castes in the total population of major states
Triangulating survey data
While the 2011 data is the starting point, we need to triangulate data from different surveys and ethnographic accounts to get a sense of the jati-level progress on key indicators. There are only three nationally representative datasets that we are aware of, which provide jati identifiers, and we employ all three in our analysis, as described below.
Moreover, even using these datasets, it is not possible to assess whether access to reservation has been uneven. This is because there is no direct data on the proportion of different jatis in Scheduled Caste-reserved positions.
We have estimated within-Scheduled Caste heterogeneity using data from three different surveys. From the second round of the India Human Development Survey (IHDS) 2011–12, we have data on years of education, number of assets owned by households, whether a household is below the poverty line, whether any household member has experienced untouchability, on household income per capita, and if the household holds a reserved category certificate.
We also use data from the Centre for Monitoring Indian Economy (CMIE)’s Consumer Pyramids Household Survey (CPHS), Waves 16, 17, and 18 from 2019 for data on years of education, unemployment, proportion in wage/agricultural labour jobs, and proportion in white collar jobs. Finally, data from the fourth round of the National Family and Health Survey (NFHS) 2015-16, has years of education, whether a household owns land, the acreage, the proportion that own a pucca house, the number of assets owned, and an asset index.
In the interest of brevity, we are presenting results from the CMIE survey for 2019 and from the IHDS for 2011-12. Even though these two surveys have very different sampling methodologies and sample sizes, the rounds we have chosen are a decade apart, and hence present a rough indication of the change over time. Results from the NHFS are available at this link.
Andhra Pradesh
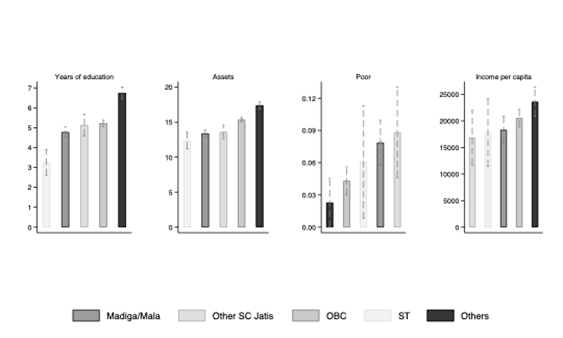
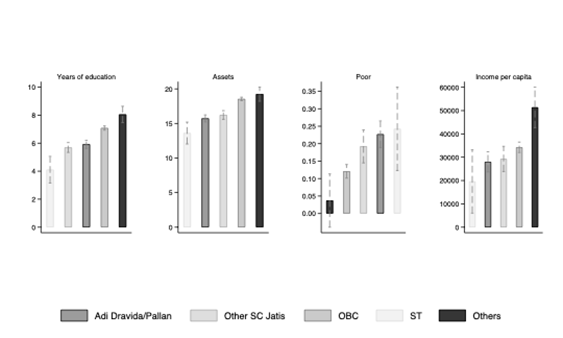
The two major Scheduled Caste jatis in united Andhra Pradesh are Malas and Madigas. Figure 2 shows a comparison between Malas and Madigas considered together, other Scheduled Caste jatis, Other Backward Classes (OBCs), Scheduled Tribes, and everyone else (Others).
Figure 2: Select indicators by jati, Andhra Pradesh - I
In 2000, undivided Andhra Pradesh experimented with subdividing the Scheduled Caste quota. The Scheduled Caste castes were subdivided into A, B, C, D categories with different quotas for each group. This was in operation for four years before it was struck down by the Supreme Court in 2004.
Figure 2 for 2011–12 reveals that that the Madiga/Mala and other Scheduled Caste jatis are statistically equivalent on the four socio-economic indicators: years of education (roughly five, compared to seven for the non-SC-ST-OBCs), number of assets (14–15), proportion that is poor (6–8%), and income per capita.
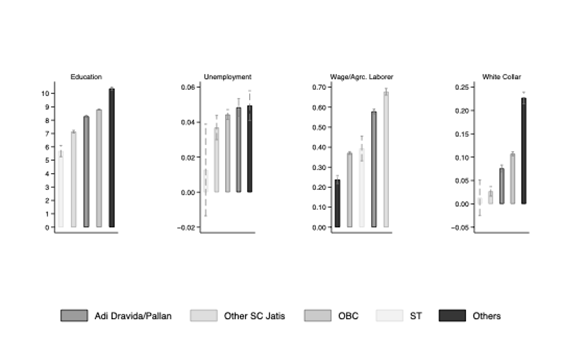
Figure 3: Select indicators by jati, Andhra Pradesh - II
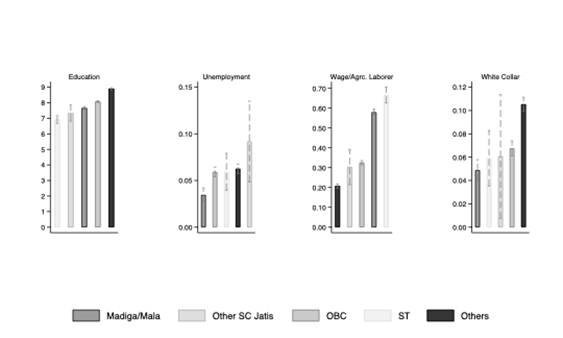
In 2019, all groups had higher levels of education but all Scheduled Caste jatis had statistically equivalent years of education (Figure 3). Mala/Madiga was less likely to be wage/agricultural labourers, and more likely to be in white collar jobs compared to other Scheduled Caste jatis.
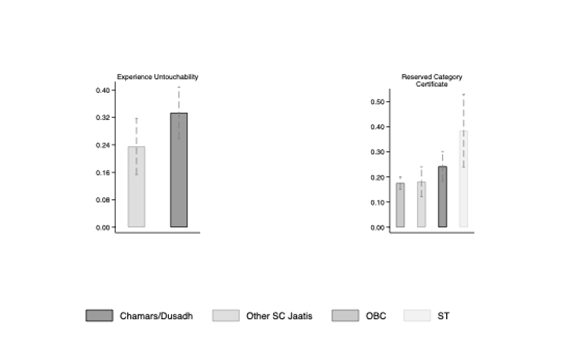
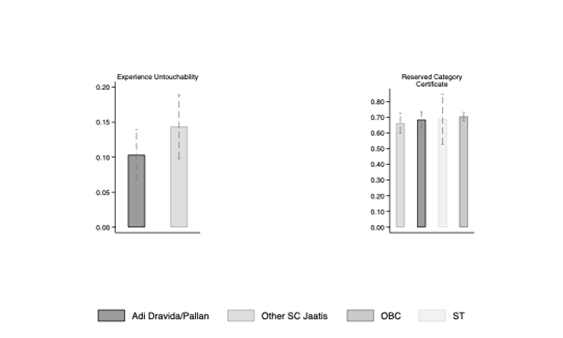
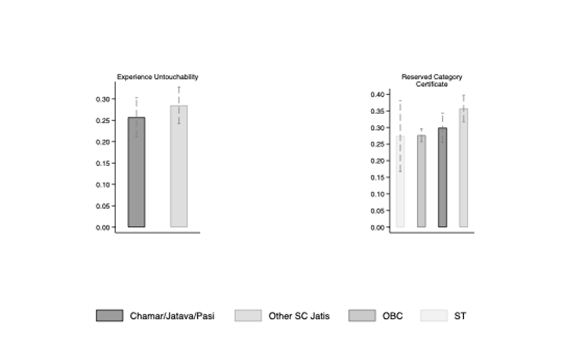
The IHDS 2011-12 survey has two indicators that are unique to it – on the prevalence of untouchability and whether the eligible castes have a reserved category certificate. As a certificate is essential to make use of reservations, it can serve as a rough proxy for access to the benefits of affirmative action. We should note that the IHDS data are not representative at the state level, except perhaps for large states.
Figure 4: Experience of untouchability and possession of Reserved Category Certificate, Andhra Pradesh
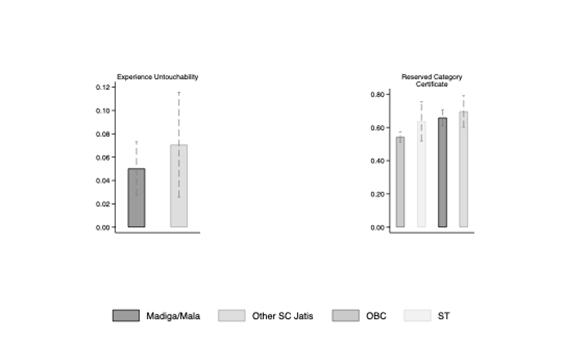
While the point estimate of other Scheduled Castes reporting untouchability is higher, statistically it is similar to the proportion of Madiga/Mala reporting having experienced untouchability (Figure 4). Access to reserved category seats is possible only when individuals possess the requisite certificate. About 65% to 70% of Scheduled Castes and Scheduled Tribes report possessing the certificates, while OBCs report a lower proportion (38%).
Overall, there does not seem to be a great deal of heterogeneity within Scheduled Castes in the undivided Andhra Pradesh. On the other hand, consistently on all indicators and across time, the Others display a substantive advantage.
Bihar
Bihar is one of the states that introduced subdivision by creating a category of Mahadalits ('more dalit than the Dalits') in 2007, where initially all but four of the 22 Scheduled Caste jatis were designated as such. Nitish Kumar established a Mahadalit Vikas Mission, and introduced schemes for housing, education, loans, and so on. Over time, the four remaining castes clamoured for inclusion into the new category, bringing Bihar back to square one. All Scheduled Castes in the state are now Mahadalits.
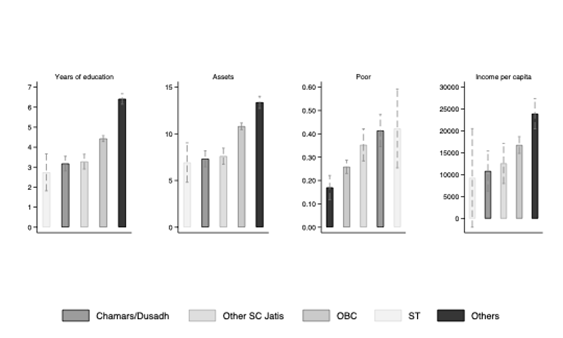
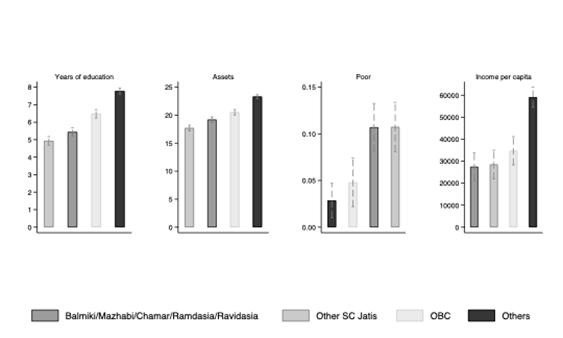
The two major Scheduled Caste jatis in Bihar are Chamar and Dusadh. We see that in 2011–12, in terms of years of education (roughly three), number of assets (roughly 7-8), proportion that is poor (35% to 40%), and income per capita, all Scheduled Castes in Bihar were comparable (Figure 5). Since the data is four to five years after the creation of the Mahadalit category, these indicators should reflect at least the short-term effect of that policy, if any.
Figure 5: Select indicators by jati, Bihar - I
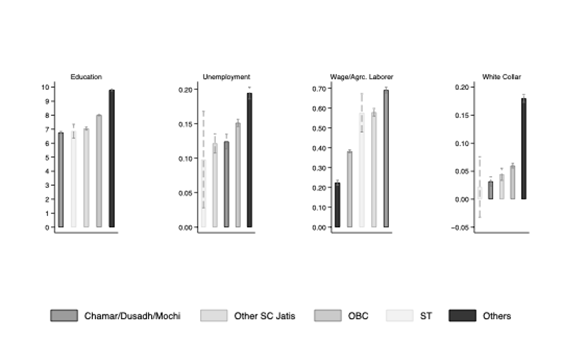
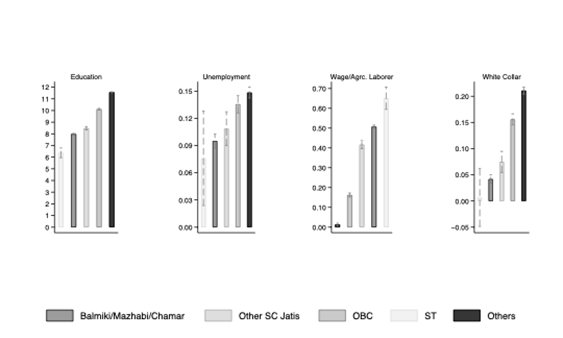
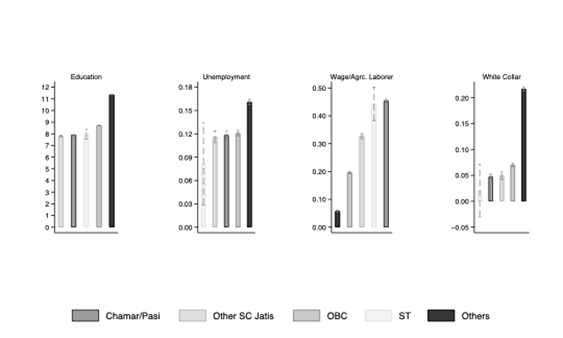
The CPHS 2019 data reveals that the two largest jatis have 6.76 years of education (compared to 7.04 for other Scheduled Castes), with 69% working as agricultural/wage labourers and only 3% in white collar occupations (Figure 5).
Figure 6: Select indicators by jati, Bihar - II
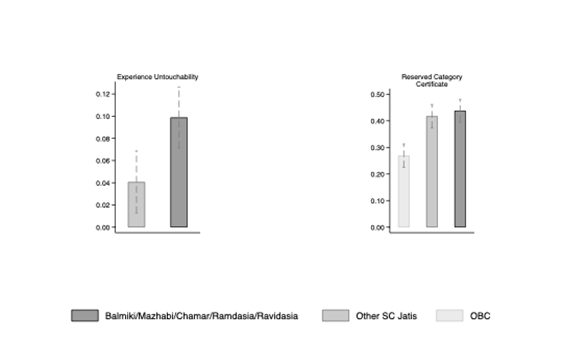
IHDS 2011–12 data reveal that higher proportions of Chamars and Dusadhs report experiencing untouchability (33%) compared to other Scheduled Castes (24%). They are also more likely to possess a reserved category certificate (24%, compared to 16% of other Scheduled Caste jatis).
Figure 7: Experience of untouchability and possession of Reserved Category Certificate, Bihar
Punjab
The Punjab government in 1975 divided the Scheduled Caste quota into two halves: 50% for the relatively backward Mazhabi Sikhs/Balmikis/Churahs within Scheduled Castes, and the remaining 50% for the more successful Ad Dharmis/Ravidasis/Ramdasi Sikhs/Chamars. There are claims about how this increased representation of the former group in government employment, but not in the official data.
Figure 8: Select indicators by jati, Punjab - I
The data for Punjab (Figure 8) is from 35 years after the policy of subdivision was introduced. Thus, the effects of subdivision should be reflected in these outcomes. We see that the two largest groups, comprising Mazhabi Sikhs/Balmikis/Churahs and Ad Dharmis/Ravidasis/Ramdasi Sikhs/Chamars are better off than other Scheduled Castes in some dimensions (years of education, number of assets) and similar to other Scheduled Castes in terms of income per capita.
By 2019, the Mazhabi Sikhs/Balmikis/Churahs and Ad Dharmis/Ravidasis/Ramdasi Sikhs/Chamars groups had slightly lower years of education than other Scheduled Castes. They were more likely to be wage/agricultural labourers, or in white collar jobs (Figure 9).
Figure 9: Select indicators by jati, Punjab - II
The two largest Scheduled Caste groups in Punjab report experiencing greater untouchability than other Scheduled Castes, but have a similar proportion holding reserved category certificates.
Figure 10: Experience of untouchability and possession of Reserved Category Certificate, Punjab
Tamil Nadu
Figures 11 and 12 show a similar exercise as the preceding states, comparing the two largest Scheduled Caste jatis (Adi Dravida and Pallan) with other groups in the state using IHDS and CMIE CPHS, respectively. Heterogeneity within Scheduled Caste jatis was virtually non-existent in the state in 2011–12 with all groups showing comparable outcomes.
Figure 11: Select indicators by jati, Tamil Nadu - I
In 2019, the two largest Scheduled Caste groups had advanced in terms of years of education. There was a lower probability of their being in wage or agricultural labour jobs and a higher probability of their being in white collar jobs (Figure 11).
Figure 12: Select indicators by jati, Tamil Nadu - II
It is noteworthy that Tamil Nadu has the highest proportion of individuals with reserved category certificates (roughly 70% across all categories) (Figure 12).
Figure 13: Experience of untouchability and possession of Reserved Category Certificate, Tamil Nadu
Uttar Pradesh
Uttar Pradesh is India’s most populous state and has in the past been governed by a Dalit Chief Minister. With 21% of its population comprising Scheduled Castes, it is amongst the states with a high proportion of Scheduled Castes. The two largest Scheduled Caste castes are Chamars/Jatavs and Pasis.
Figure 14 shows the relative position of caste groups in 2011–12. Across almost all indicators, the gaps between the two largest Scheduled Caste groups and other Scheduled Caste jatis were insignificant.
Figure 14: Select indicators by jati, Uttar Pradesh - I

By 2019, in terms of years of education and access to white collar jobs, there were no major differences among Scheduled Castes. However, Chamars/Jatavs and Pasis were less likely to be in wage/agricultural labour jobs compared to other Scheduled Castes (Figure 15).
Figure 15: Select Indicators by Jati, Uttar Pradesh - II
Amongst Scheduled Caste jatis other than the two largest groups, 36% report having caste certificates, which is significantly higher than the Chamar/Jatav/Pasi groups (Figure 16).
Figure 16: Experience of untouchability and possession of Reserved Category Certificate, Uttar Pradesh
West Bengal
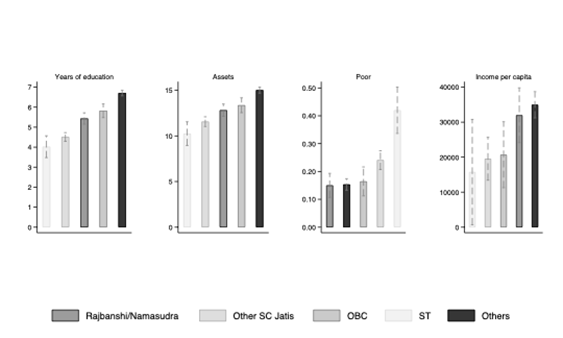
West Bengal, with an SC population of 23.5%, has two large groups in the Scheduled Caste list: Rajbanshi and Namasudras. In 2011–12, they had higher years of education, a greater number of assets, a lower proportion reporting as poor, and income per capita comparable to other Scheduled Castes.
Figure 17: Select indicators by jati, West Bengal - I
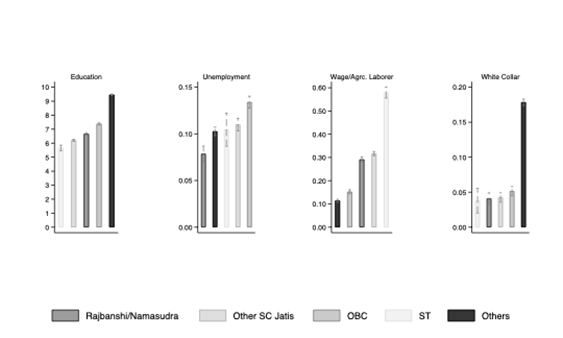
By 2019, there is some differentiation in that the Rajbanshi and Namasudras report slightly higher years of education and a slightly lower probability of being in wage labour/agricultural labour jobs. They have similar proportions in white collar jobs.
Figure 17: Select indicators by jati, West Bengal - II
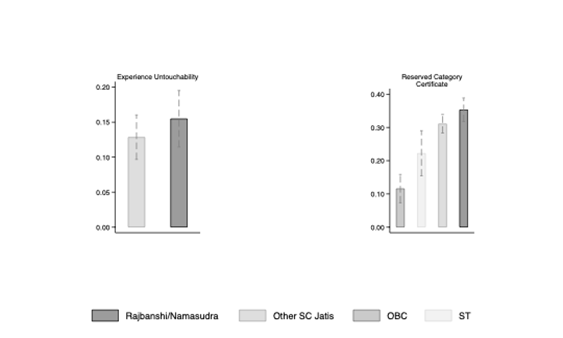
The two largest Scheduled Caste groups report a marginally higher experience of being subjected to untouchability but have the highest proportion amongst all groups with caste certificates, which gives them the potential to apply for reserved seats (Figure 18).
Figure 19: Experience of untouchability and possession of Reserved Category Certificate, West Bengal
What the evidence reveals
The data for these six states, two of which have an explicit policy of subdivision in place, and one which experimented with a subdivision policy for four years reveals some common features.
One, for the most part, the heterogeneity within Scheduled Castes is not substantial (despite some tentative evidence of heterogeneity in 2019), whereas the gap between all Scheduled Castes and non-SC-ST-OBCs (the so-called General Category, a proxy for groups high in the socio-economic hierarchy) continues to be significant across all states.
Two, despite reservations being in effect for at least 75 years, the proportions amongst eligible populations reporting having a caste certificate continues to be noticeably low (well below 50%). The two southern states in our analysis are exceptions to this pattern, with Tamil Nadu reporting more than 70% and Andhra Pradesh more than 60%.
In principle, quotas within quotas could be justified, provided there is systematic tracking of jati-level outcomes. The evidence based on household surveys indicates that the bigger issue is ensuring access to reservations for all Scheduled Castes and targeting the broader Scheduled Caste-upper caste disparities.
Given that reservations produce tangible benefits even for a small minority, there will be a clamour to get into the preferred sub-category, unless there is a Punjab-like policy that divides the quota 50-50 for two roughly equal-sized broad groups. Bihar’s story tells us that these decisions will be politically rather than empirically driven.
The Supreme Court judgement notes that empirical data, “reasonable” grounds that will be subject to judicial scrutiny would be needed to convert the idea of a sub quota into actual policy and avoid the perils of “micro-classification.” Since there is no sign of the national census on the horizon and there is no tracking of reservation benefits at the jati level, it is difficult to see how this judgement will get converted into a fair and actionable policy.
The second issue in the court verdict is about families that are economically well off so that they do not need protective discrimination. The majority opinion recommends a creamy layer exclusion be applied to Scheduled Castes and Scheduled Tribes, as it is applied to Other Backward Classes.
The affirmative action policy has quotas as well as monetary benefits (scholarships or freeships), or relaxation for instance, lower fees). The income criterion can be used to decide on eligibility for the monetary component so that the monetary benefits are available for those who genuinely need it.
In addition, quotas, especially in employment, can possibly ease the access to well-paid government jobs. However, there is no evidence that improvement in class status necessarily reduces discrimination for historically stigmatised groups, whether in access to jobs, housing, or even the marriage market. Despite untouchability being abolished, covert and overt instances of untouchability persist. As elsewhere in the world, the stamp of a stigmatised social identity does not disappear easily with economic mobility. Rohith Vemula’s tragic end brought home that for beneficiaries, access into institutional spaces does not naturally translate into acceptance and accommodation.
Reservations have helped in creating a Dalit middle class, which over time can reduce stigma and gradually set the stage for creamy layer exclusion in the future. However, we are not there yet.
The Supreme Court’s concern with differential access within beneficiary groups is, in principle, not an invalid one. But the court and the various arms of the government need to focus on an evidence-based big picture, including data on which specific groups are getting disproportionate access to reservations. Most importantly, the overdue national census is the only data source that will shed light on the contemporary state of inter-caste disparities, which according to survey data, continue to be substantial.
Acknowledgment: We thank Ayush Shahi, fourth-year undergraduate student at Ashoka University, for excellent research assistance.
Ashwini Deshpande is with Ashoka University, Sonipat, and Rajesh Ramachandran is with Monash University Malaysia. The views expressed are personal.