


While there is euphoria about fertility levels in India reaching replacement levels and the consequent reduction in population growth, the country's demographic diversity continues to attract attention. India’s overall demographic achievements often conceal the vast variations that exist across different parts of the country; variations that have significant economic, social, and political implications. Thus, while the demographic dividend has been discussed widely, it is important to note that some states are now completing the dividend period, and others have yet to enter it (James et al. 2023). Further, the large potential emanating from demographic change may help the regions making the demographic transition early to advance economically further, leading to more inequity across regions.
A significant milestone has been achieved in India, with most states completing their fertility transition (i.e. reaching an average of 2 children per woman). However, a few states, particularly from the northern and central regions, are still experiencing a slightly higher fertility rate. The large population concentration in its socio-economically laggard states of Bihar, Chhattisgarh, Jharkhand, Madhya Pradesh, Odisha, Rajasthan, Uttar Pradesh, and Uttarakhand – the so-called Empowered Action Group (EAG) states. It is further projected to increase in these states in the coming decades, while the population shares of their southern counterparts – Kerala, Tamil Nadu, Karnataka, Andhra Pradesh, and Telangana – continue to decline further (Kulkarni, 2021).
The large potential emanating from demographic change may help the regions making the demographic transition early to advance economically further, leading to more inequity across regions.
This article provides a nuanced understanding of India's demographic diversity and its multifaceted implications. Emphasising the changing population dynamics across India, we highlight the regional heterogeneity in the demographic and age-structural transition and its wider implications due to the cost of ageing, and issues such as a growing incidence of non-communicable diseases and that of political representation. The article concludes with the importance of considering the stage of demographic change for policy and programme interventions to ensure the well-being of all.
Through a regional lens
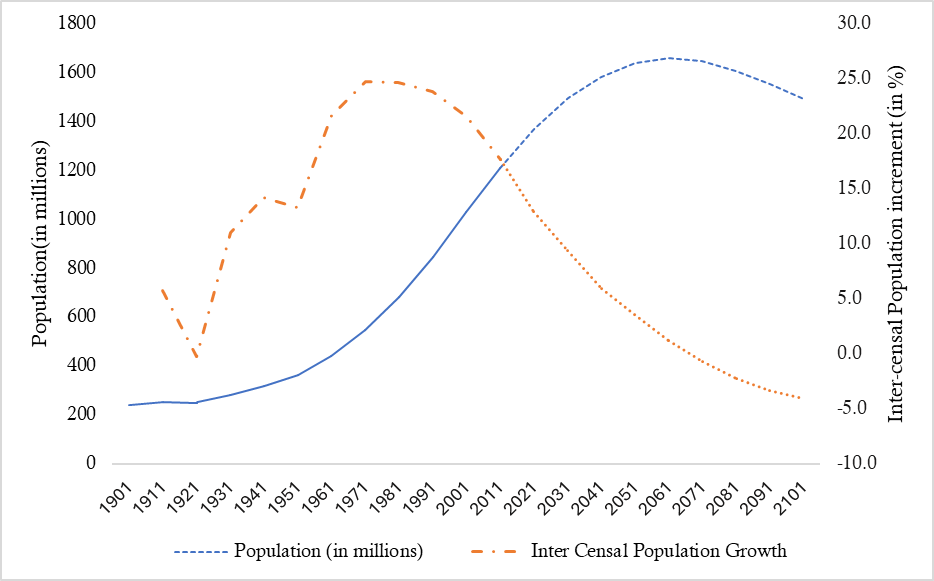
Historically an agrarian economy with a more or less stable population until the 19th century characterised by high birth and death rates, India’s population dynamics have evolved over time in an unprecedented manner. Population change during 1901–2011 illustrates a significant growth at a varying pace. It increased steadily to 361 million from 238 million through the course of the early half of the 20th century, exhibiting, a positive inter-censal growth rate throughout the period, except for a slight decrease during 1911–1921 (Figure 1).
Population surged dramatically in the latter half of the 20th century, almost doubling between 1951 (361 million) and 1981 (683 million) — recording the highest ever inter-censal population growth rate of 25% during 1961–71 (Figure 1). This period is referred to as the period of the population explosion accompanied by the 'Green Revolution'. The decadal growth rate, however, started decelerating thereafter, with the projected inter-censal growth rate receding by nearly half during 2011–2021, compared to 1961-1971 (Figure 1).
Figure 1. Population Growth in India, 1901-2101
At the same time, the deceleration in population growth has not been uniform, resulting in drastic changes in the regional shares of the population, particularly since the 1980s. The projected population shares of regions shows an increasing demographic heterogeneity in the coming decades, which will be present until the end of this century. To delve deeper, we have used a regional classification – the EAG states, the southern states, and the rest of India – which is widely used by demographers to understand the demographic landscape of India.
The trends in population shares across these key regions are shown in Figure 2. Not only do the EAG states have the highest population shares and the southern states the lowest, there will also be a significant shift in the shares in the coming decades, with a widening of the gap over time. The population share of EAG states, which has marginally increased to 46% in 2011 from 44% in 1951, is projected to shoot up to 58% by 2101. This is despite the fact that many EAG states are also currently experiencing a faster decline in fertility. Conversely, the population share of the southern states declined to 21% in 2011 from 26% in 1951, and is projected to decline to 15% by 2101. The rest of India’s population share, however, shows a mixed trend between 1951 and 2101, but the share in 2101 is not projected to significantly come down from its 1951 level.
Figure 2. Trends in Regional Shares in Populations of India, 1951-2101
These diversities persist not only across regions but within the regions as well, particularly in the EAG group of states. For instance, just two EAG states, Bihar and Uttar Pradesh, constitute more than half of the EAG’s total population share since 1951. These two states are projected to experience a relatively rapid rise in their population share until 2051. Jharkhand and Uttarakhand, on the contrary, have remained more or less stable ever since 1951.
On the other hand, the southern states exhibit less pronounced state-wide disparities. All southern states have experienced a considerable decline and their population shares are projected to decline further in between 1951 and 2101. Tamil Nadu, Kerala, Andhra Pradesh (including Telangana) and Karnataka showed a decline in their population shares by 54%, 49%, 38% and 29%, respectively, between 1951 and 2101. Himachal Pradesh and Punjab are the other two states from the rest of India that have experienced around 40% declines in their population shares (Table A.1).
The regional diversity in fertility in India is guided by variations in heterogeneous adoption of population policies and their implementations and partly also due to their different socio-cultural systems.
The regional heterogeneities in demographic shifts are largely attributed to the heterogeneity in fertility rates. India’s fertility transition began in the mid-1970s, with a slow pace of decline during the initial years and a steadier decline from the 1980s onwards. Within just a short span of four and a half decades (1975-2021), India attained replacement levels with TFR levels at 2.1 as of 2020. India’s fertility transition is one of the quickest amongst major countries, next only to China. Fertility transition, however, has not been the same across India's regions owing to the diverse socio-economic, political and cultural factors across regions, alongside the regional variations in implementation of family welfare programmes (Shekhar, Goli and Mishra, 2023).
The fertility trends clearly manifest a heterogeneous fertility transition and an uneven rate of change across regions (Figure 3). EAG states exhibit higher TFR levels, while the southern states and the rest of India exhibit lower total fertility rates. Between 1992–93 and 2015–16, the southern states exhibited a steady decline in TFR levels, attaining sub-replacement levels in 2005-06 and reaching low fertility by 2021 (i.e. an average TFR of 1.7), while the rest of India converged with them rapidly by 2019-2021. The EAG states, on the contrary, exhibited a decline over time but at a relatively slower pace.
Post-2005-06, however, fertility level differentials across regions are narrowing with a steady and improved rate of decline in TFR levels among EAG states as well.
Figure 3. Total Fertility Rates across regions in India, 1992-93 to 2019-21
Although the EAG states are yet to attain below-replacement fertility levels, this does not hold true for all EAG states. State-wise TFRs for 2019–21 indicate that except for three states, namely Bihar, Uttar Pradesh, and Jharkhand, all other EAG states record fertility in the replacement range (Figure A.1).
The regional diversity in fertility in India is guided by variations in heterogeneous adoption of population policies and their implementations and partly also due to their different socio-cultural systems (James, Rajan and Goli, 2022). At the same time, it is important to note that the magnitude of regional differences is far higher than other commonly assessed variations of socio-cultural factors in India viz., religious, caste or educational differences. Besides, variations in the onset of fertility transition across the states are also a significant reason for regional heterogeneity in fertility levels. While the onset of fertility transition in the southern states, the leaders of fertility transition, was around the mid-1970s, it began only around the mid-1980s or early 1990s in several EAG states (Table 1).
Table 1. Variation in Onset of Fertility Transition across Indian States
Implications of demographic diversity
Regional variations in fertility rates and significant changes in the share of population have major implications for the age structure in each state. For instance, while EAG states have the largest share of child population in the total population, the southern states, on the contrary, have had the largest share of older persons in the population since 1991. In addition, the share of children would nearly halve amongst the southern states between 1991 (34%) and 2031 (18%) and the share of older persons would nearly double during the same period (Technical Group on Population Projections Report, 2020).
Unless compensated adequately, the households in the southern states can fall into poverty easily with the increasingly older population having a disability.
These changes will inflict larger old-age dependency burdens over time in the southern states. Though the dependency ratio (which estimates the burden of both the child and older populations) remained the lowest for the Southern states and highest for EAG states ever since 1991, due to a faster decline in fertility in the former the gap across the regions has declined over time (Figure A.2). EAG states are exhibiting a drop in the dependency ratio, suggesting a decline in fertility and a consequent increase in the share of the working age-group population in these states. The southern states, on the other hand, are experiencing a dependency burden from having a larger proportion of the older population. Despite these changes, the dependency ratio will continue to be higher in EAG states even in 2031 due to the late fertility transition as compared to the Southern states.
All these changes will provide major challenges, particularly in the distribution of resources from the centre to the states. A higher proportion of the older population undoubtedly signifies major costs in terms of health and functional disabilities. The estimates available on the cost of functional disability across countries show a staggering 30-50% additional cost for a family with a disabled (Mitra et al. 2017). In other words, an additional income of 30% to 50% is required to maintain the same standard of living for a household with a functionally disabled older person. The data show that nearly a quarter of older persons in India are functionally disabled (Mitra et al. 2017). Unless compensated adequately, the households in the Southern states can fall into poverty easily with the increasingly older population having a disability. Therefore, population transition needs to be integrated into all policy domains, failing which there could be a significant negative fallout on the well-being of the people.
Regional heterogeneity in demographic and age-structural transitions has even led to an uneven health burden from communicable and non-communicable diseases across India.
A large proportion of the Indian population depends upon private healthcare, which results in a higher degree of impoverishment due to the huge cost involved in healthcare. Regional heterogeneity in demographic and age-structural transitions has even led to an uneven health burden from communicable and non-communicable diseases across India. As shown in Figure 4, over time, the burden of deaths from non-communicable diseases has been rising, and, in contrast, that of communicable diseases is declining in India. However, there is a significant difference in the pattern of disease burden across EAG states and southern states. The southern states had a 13% higher share of non-communicable diseases than the EAG states in 1991. Although the difference has narrowed over the period, an additional 10 percentage points in the proportion of non-communicable diseases in southern states inflict huge economic burden on the households in this region. Unless compensated adequately for the high health care consequent to epidemiological change, the well-being of the population could be under serious strain. It is high time that the allocation of resources across states in India takes into account the heterogeneity inherent in demographic and epidemiological transition in the country.
Figure 4. Causes of Deaths across Regions of India, 1991 -2021
Additionally, with a rising share of an ageing population, out-of-pocket expenditures (OOPEs) for accessing health care is also poised to rise with the rising burden of non-communicable diseases. For instance, in the case of cardio-vascular diseases (CVDs) — one of the most prominent non-communicable diseases in later ages — the estimates from the National Sample Survey (Figure 5) suggest that out of the all-India total of OOPEs on CVDs, the share of the southern and EAG states are 32% and 24%, respectively, for 2017–18. Despite a slight decrement in the share of OOPEs on CVDs in the Southern states between 2004–05 and 2017–18, the burden for the southern states still poses a serious concern, especially when we consider that they comprise just one-fifth of the total population of India. Conversely, with nearly half of the total population of India, the EAG states spent just one-quarter of total OOPEs on CVDs. Thus, regional differences in demographic profiles need to be considered in healthcare policy and planning.
Figure 5. Region-wise percentage share contribution of out-of-pocket expenditure for cardiovascular diseases in India, 2004-15 & 2017-18
India’s changing demographic landscape with significant changes in population shares between states is expected to have substantial political implications too, especially regarding electoral representation or the allocation of state-wise parliamentary seats in India. As evident from the projected population for 2026, from the Report of Technical Group on Population Projections for India and States (2011-2036), the population shares of Bihar, Uttar Pradesh, Madhya Pradesh and Rajasthan have experienced a notable rise, while all Southern states, Punjab, Himachal Pradesh and Maharashtra have experienced a significant decline in population shares. This uneven population growth has ignited a political debate on the possible loss of representation for some states once the freeze on the boundary of the constituencies based on the 1971 population is lifted. The current freeze on the total number of seats both in Parliament and state assemblies will end in 2026.
Uneven population growth has ignited a political debate on the possible loss of representation for some states, once the freeze on the boundary of the constituencies based on the 1971 population is lifted.
We have estimated the gain or loss in the number of parliamentary seats across the states using the Webster method with minor amendments, assuming that the seat reallocation would be done based on equal population representation. The estimates based on the projected population show that the majority of EAG states are going to gain a significant number of parliamentary seats in 2026 (Figure 6). Amongst them, Uttar Pradesh would gain the maximum of 12 seats, followed by Bihar (10) and Rajasthan (7). On the contrary, all the southern states are projected to lose a significant number of seats, with a maximum of 9 seats for Tamil Nadu, followed by Kerala with 6 seats, and Andhra Pradesh with 5 seats.
Figure 6. Projected Number of Gain ( ) or Loss (-) in Parliamentary Seats in the Lok Sabha as per Projected Populations of 2026
The implications of demographic changes for political representation have been a matter of contention in India. Perhaps, the inter-state migration trends would address some of these issues partially, as the current understanding of the population in future does not incorporate the impact of the possible changes in migration patterns.
However, the large variation in population and the population momentum expected in the future will have a far bigger impact than differential migration flows on population shares. According to the latest Migration in India Report 2020-21, inter-state migration stands at 7.3% and 19.8% from rural and urban areas, respectively (Government of India 2022). EAG states like Uttar Pradesh and Bihar are significant sources of out-migration whereas states such as Maharashtra, Delhi, Gujarat and Karnataka are major destinations for in-migrants.
While migration can address the population distribution at a small scale, large migration streams also bring new challenges to the destination states, especially regarding access to social security measures, health care and education for the families of unskilled and informal migrant workers. This calls for more robust social security measures and improved access and provision of necessitated amenities crucial to them.
Conclusions
Stark regional variations mark India’s demographic diversity, with the EAG states exhibiting a decade or more of a lag in their demographic transition compared to the southern states and the rest of India. This, in turn, would pose multi-faceted demographic, economic, health care and political challenges, which need to be tackled with region-specific policies on population, health and social welfare.
A uniform approach to policies and programmes may not work in India, given the considerable variation in population and age structure. Higher fertility rates and a young population in EAG states and, conversely, lower fertility rates and an ageing population in southern states necessitate a significant variation in approach to health care needs, compensating for the huge cost of ageing and disability. These differentials in health care need to be carefully mapped and understood before making strategic interventions so that demographic changes do not lead to a reduction in the population's well-being in some parts of the country.
Changing regional shares in population pose a serious challenge to political representation in the coming years. The concerns regarding fair political representation and imbalances in political power across the states also need to be catered. Perhaps a nuanced approach to effectively handle the issue by considering various factors that ultimately help in ensuring the well-being of the population needs to be considered even for political representation.
While it is easy to make sure that the number of representatives is not brought down in any state by increasing the overall seats, it will further skew the share of seats considerably across states. On the other hand, with the rapid expansion of road networks, communication facilities and digital connectivity, the political representatives can now serve more population easily as compared to the situation in 1971. Therefore, it is not merely the overall increase that matters in such a case but the emerging needs of the population groups that warrant more attention.
Thus, India needs a nuanced, multifaceted approach to address the demographic diversity across states and navigate its demographic transition effectively, ensuring development across its regions, emphasising the specific needs due to population changes, bridging socio-economic demographic disparities to foster citizen-centric inclusive growth and, finally, ensuring the well-being of all.
Acknowledgements: The authors thanks Srinivas Goli, associate professor at International Institute for Population Sciences, Mumbai, for his valuable research assistance during analysis and drafting of this article.
K.S. James is a senior visiting scholar, Newcomb Institute, Tulane University, USA. Shubhra Kriti is a doctoral student at International Institute for Population Sciences, Mumbai.
